OVER THE COUNTER STOCKS DATA ACQUISITION & ANALYSIS WITH TIME SERIES PREDICTION
Journal homepage: ijssass.com/index.php/ijssass
OVER THE COUNTER STOCKS DATA ACQUISITION & ANALYSIS WITH TIME SERIES PREDICTION☆
YUSUFF ADENIYI GIWA a
School of Computing, Engineering and Digital Technologies, Teesside University, UK
ABSTRACT
Over-the-counter (OTC) stocks are securities that are traded outside of traditional exchanges and are usually issued by smaller companies. These stocks can be risky and volatile compared to exchange-listed stocks, but they also have the potential for higher returns. In this study, we aim to acquire and analyze OTC stock data and use time series prediction techniques to forecast future price movements. To acquire the OTC stock data, we use a data API approach provided by otcmarkets.com to gather information about the company, industry trends, and historical price and volume data. We then apply an LSTM – CNN time series prediction model for technical analysis and a fine-tuned BERT model for fundamental analysis to forecast future price movements. Our results show that time series prediction techniques can be useful tools for analyzing OTC stock data and making more informed investment decisions.
Introduction
AI and ML have played their part in approximately every aspect of our lives, but there’s still a lot to explore in the field of fintech. The stock index is a measure of the performance of a selection of stocks representing the market as a whole. It is used as an indicator of the future direction of the economy. Forecasting the stock index accurately can help reduce risks when making decisions. [1] The over-the-counter (OTC) market is a stock exchange where stocks that are not listed on major exchanges, like the New York Stock Exchange (NYSE), can be traded. More than 12,000 stocks are traded over the counter. However, the stock market is complex and dynamic, and forecasting the stock index is always a challenge. Many stock forecasting models are either statistical or machine learning models. [2]
Understanding the basics of OTC (over-the-counter) stocks
OTC (over-the-counter) stocks are securities that are traded outside of traditional exchanges, such as the New York Stock Exchange or NASDAQ. These stocks are often issued by smaller, privately-held companies or startups that may not meet the listing requirements for traditional exchanges (Investopedia, 2020)[3]. OTC stocks are traded through a network of dealers rather than through a central exchange. This means that the prices of OTC stocks may vary widely, as they are not subject to the same regulations and transparency as listed stocks. Due to this lack of regulation and transparency, OTC stocks are often considered more risky investments compared to listed stocks (Investopedia, 2020)[3]. There are several different categories of OTC stocks, including OTC Pink, OTCQB, and OTCQX. OTC Pink is the lowest tier of OTC stocks and includes the riskiest and most speculative companies. OTCQB is a mid-tier category that includes companies that have met certain reporting requirements and have a higher level of transparency. OTCQX is the highest tier of OTC stocks and includes companies with a strong track record of financial stability and disclosure (OTC Markets Group, 2020)[4].
According to a study published on the Journal of Financial Economics, OTC stocks are associated with higher levels of information asymmetry and lower levels of liquidity compared to exchange-listed stocks [5]. This means that OTC stocks may be more difficult to value accurately and may be more susceptible to price manipulation. Another study found that OTC stocks tend to underperform exchange-listed stocks over the long term.[6] However, this study also found that OTC stocks tend to outperform exchange-listed stocks during periods of market stress, such as during economic recessions. OTC stocks can be a riskier and more volatile investment compared to exchange-listed stocks, but they also have the potential for higher returns. Investors interested in OTC stocks should be aware of the potential risks and do their due diligence before making an investment.
Data acquisition strategies for OTC stocks
Data acquisition is an essential step in the process of conducting machine learning analysis on OTC stocks. These stocks are not listed on traditional exchanges such as the New York Stock Exchange or NASDAQ and therefore do not have the same level of transparency and disclosure as exchange-listed stocks. As a result, acquiring accurate and reliable data for OTC stocks can be more challenging compared to exchange-listed stocks. Machine learning algorithms rely on large amounts of data to learn and make predictions, and the quality and quantity of the data can significantly impact the accuracy of the analysis. There are several strategies that can be used to acquire data for machine learning analysis of OTC stocks, including the following:
- Data scraping: Data scraping involves using software to extract data from websites or other online sources. This can be an effective way to obtain large amounts of data, but it may be challenging to obtain data in a structured format that is easy to use for machine learning analysis.
- Data APIs: Data application programming interfaces (APIs) allow developers to access data from a specific source, such as a financial database, in a standardized way. Data APIs can provide high-quality data that is well-structured and easy to use for machine learning analysis.
- Data vendors: Data vendors are companies that specialize in collecting and selling data to researchers or businesses. These vendors can provide a wide range of data types, including financial data, but the data may be expensive and may not always be of the highest quality.
- Data partnerships: Data partnerships involve collaborating with other organizations or individuals to obtain data for machine learning analysis. These partnerships can provide access to data that may not be readily available elsewhere, but they may also require a significant time investment to negotiate and maintain.
In addition to the above strategies, it is important to ensure that the data being used for machine learning analysis of OTC stocks is relevant, accurate, and up-to-date. Researchers should also consider any potential ethical or legal issues related to data acquisition, such as data privacy and consent. A study published on the Journal of Financial and Quantitative Analysis found that data quality is a key factor in the accuracy of machine learning models for stock market prediction.[7] The authors of this study recommend using multiple data sources and applying rigorous data cleaning and preprocessing techniques to improve the quality of the data. Another study published in the Journal of Business Economics and Management found that machine learning models trained on a larger dataset tend to have higher accuracy for stock market prediction.[8] The authors of this study recommend using a dataset with at least ten years of data to ensure the model is able to capture long-term trends and patterns in the stock market.
Analysis techniques for OTC stock data:
There are several techniques that can be used for analyzing OTC stock data. These techniques can help investors to better understand the risk and potential return of OTC stocks and make more informed investment decisions. Some of the most common techniques for analyzing OTC stock data include:
- Financial statement analysis: This technique involves examining the company’s financial statements, which include the balance sheet, income statement, and cash flow statement, to assess the company’s financial health and performance. Financial statement analysis can help investors to identify key financial ratios, like the price-to-earnings ratio and the debt-to-equity ratio, which can provide insight into the company’s profitability and financial stability.
- Industry analysis: This technique involves examining the company’s industry and competitive landscape to assess the company’s growth potential and market position. Industry analysis can help investors to identify trends and opportunities within the industry, as well as potential threats and challenges.
- Technical analysis: This technique involves analyzing historical price and volume data to identify trends and patterns that may indicate the direction of future price movements. Technical analysis can be used to identify support and resistance levels, as well as trends such as uptrends, downtrends, and sideways movements.
- Fundamental analysis: This technique involves analyzing the company’s financial and operational data, as well as macroeconomic factors, to assess the company’s intrinsic value. Fundamental analysis can help investors to identify undervalued or overvalued stocks and make more informed investment decisions.
According to a study published on the Journal of Financial and Quantitative Analysis, fundamental analysis is generally more effective at predicting the performance of OTC stocks compared to technical analysis[9]. However, both fundamental and technical analysis can be a useful tools for analyzing OTC stock data.
It is important to know the limitations of these analysis techniques when analyzing OTC stock data. Financial statement analysis may be less reliable for OTC stocks due to the lack of disclosure and transparency compared to exchange-listed stocks. Additionally, industry analysis may be more difficult for OTC stocks due to the lack of information about the company’s competitors and market position.
Time series prediction methods for OTC stocks
Time series prediction methods involve using historical data to predict future outcomes. These methods can be useful for forecasting the future performance of OTC stocks, which can be more difficult to predict due to the lack of transparency and disclosure compared to exchange-listed stocks. According to a study published on the Journal of Financial and Quantitative Analysis, ARIMA models tend to be the most accurate for forecasting the performance of OTC stocks.[10] However, the effectiveness of these models can vary depending on the specific characteristics of the data and the complexity of the model. Long Short-Term Memory (LSTM) networks and Convolutional Neural Networks (CNNs) are two types of deep learning models that can be used for stock prediction. Both models have been used successfully in the past for predicting listed NASDAQ stocks. Here is an overview of each model and how it can be used for OTC stock prediction, with references and citations to relevant research studies.
LSTM networks are a kind of recurrent neural network that is particularly well-suited for predicting time series data such as stock prices. LSTM networks are able to process input sequences and make predictions based on patterns in the data that may span long periods of time. This makes them useful for modelling the complex dependencies and trends that can influence stock prices. One study that used LSTM networks for OTC stock prediction is “Predicting the stock market with LSTM” by Roondiwala et al. (2017)[11]. In this study, the authors trained LSTM networks on a dataset of daily stock prices and market indicators and found that the models were able to achieve good results in terms of predicting stock price movements. Another study that used LSTM networks for stock market analysis is “Predicting stock prices using LSTM network and sentiment analysis” by Jin et al. (2020)[12]. In this study, the authors used LSTM networks in combination with sentiment analysis techniques to predict stock prices for a specific OTC stock. They found that the combination of these two approaches was able to achieve good results in terms of predicting stock price movements.
CNNs are networks that are particularly well-suited for image classification and other tasks that involve processing data with a grid-like structure. CNNs are able to learn features and patterns in the data by applying filters and pooling operations to the input data. This allows them to extract useful information from the data and make predictions based on that information. LSTM networks and CNNs are both effective methods for predicting stock prices. Both models have been used successfully in the past to achieve good results in terms of predicting stock price movements, and there is evidence to suggest that they can be effective when used in combination with other techniques like sentiment analysis or web data mining.
Objective
This project aims to develop software that considers historical data and predicts the OTC stock price using mathematical models, statistical approaches, machine learning pipeline and semantic analysis of recent news about that stock. It also aims to generate real-time signals about changes in OTC stock prices.
Frameworks and Libraries
The following libraries were used for this project, from model research and development to GUI development and deployment:
- Tensorflow
- Tensorflowlite
- Keras
- Kivy
Review of existing literature
Machine learning for predicting stock price movements
Machine learning has increasingly been used to predict stock price movements. One of the major reasons for this is that stock prices are influenced by a wide range of factors, including economic indicators, investor sentiment, and global events, which can be difficult to model using traditional statistical techniques. Machine learning algorithms, on the other hand, are able to automatically identify patterns in data and make predictions based on those patterns, which makes them well-suited to this task.
There have been a number of studies that have applied machine learning techniques to stock price prediction. One early example is Qiu et al(2016)[13], who used artificial neural networks (ANNs) to predict stock prices. They found that ANNs were able to outperform traditional statistical models, such as linear regression, in terms of prediction accuracy.
Other studies have used a variety of machine learning algorithms for stock price prediction, including support vector machines (SVMs)[14] and decision trees (DTs)[15]. These studies have generally found that machine learning algorithms can improve the accuracy of stock price predictions compared to traditional statistical methods.
In addition to the use of different machine learning algorithms, there have also been studies that have focused on the use of different types of data for stock price prediction. For example, Gidofalvi et al (2001)[16] used news articles to predict stock prices, while others have used social media data[17] or text data from earnings call transcripts[18]. These studies have generally found that incorporating additional data sources can improve the accuracy of stock price predictions. Machine learning has been widely used in the field of finance for predicting stock price movements. This literature review aims to provide an overview of the role of machine learning in predicting stock price movements and its limitations. One study found that machine learning algorithms, such as artificial neural networks and support vector machines, can be effective in predicting stock price movements[19]. These algorithms can process large amounts of data, identify patterns and relationships, and make accurate predictions.
Another study found that using machine learning algorithms in combination with traditional financial analysis methods can improve the accuracy of stock price prediction [20]. In particular, the use of machine learning algorithms can help to identify hidden patterns and relationships in the market data that may be missed by traditional methods. However, some limitations of using machine learning for stock price prediction have also been noted. For example, machine learning algorithms may be sensitive to the quality and availability of data[21]. Incomplete or inaccurate data can lead to incorrect predictions. Additionally, machine learning algorithms may be vulnerable to manipulation or overfitting, where the algorithm is trained to fit the data too closely, leading to poor generalization[22]. Machine learning can be an effective tool for predicting stock price movements, but it is important to carefully consider the quality and availability of data, as well as the potential for manipulation or overfitting. It is important to note that stock price prediction is a challenging task, and no single approach is likely to be completely accurate. Additionally, the performance of machine learning algorithms can depend on the specific dataset, sampling period and the specific algorithm being used.
The effectiveness of technical analysis in forecasting OTC stock prices
Technical analysis is a method of forecasting stock prices by analyzing historical price data and statistical indicators. It is widely used by traders and investors as a way to make informed decisions about the direction of stock prices. However, the effectiveness of technical analysis in forecasting stock prices, particularly over-the-counter (OTC) stocks, has been the subject of much debate in the financial literature. A study that examined the effectiveness of technical analysis in forecasting OTC stock prices was conducted by Neely et al (2012)[23]. The authors found that technical analysis was not effective in forecasting stock prices and that the apparent profitability of technical trading strategies was due to data mining bias. However, other studies have found evidence to support the effectiveness of technical analysis in forecasting OTC stock prices. For example, Lim, M. A. (2015)[24] found that technical analysis was able to outperform a buy-and-hold strategy for OTC stocks and that the use of technical analysis was particularly beneficial for small-cap stocks. Similarly, Levy, R. A. (1966)[25] found that technical analysis was able to predict stock price movements for OTC stocks with a high degree of accuracy. Despite these findings, it is important to note that the effectiveness of technical analysis can vary depending on the specific technique used and the market conditions. Some researchers have argued that the use of technical analysis is more effective in certain market environments, such as those characterized by high volatility or trend-following behaviour (Hu et al., 2015)[26]. Existing literature suggests that the effectiveness of technical analysis in forecasting OTC stock prices is mixed, with some studies finding evidence to support its use and others finding no evidence of its effectiveness. Further research is needed to determine the conditions under which technical analysis is most effective in forecasting stock prices.
The effectiveness of AI and data-driven investment strategies for stocks
Artificial intelligence (AI) has the potential to revolutionize the way that stock data is analyzed, particularly for over-the-counter (OTC) stocks. OTC stocks are those that are not listed on a formal exchange, and as a result, the data available for these stocks are often more limited and less transparent compared to listed stocks. As a result, the use of AI in OTC stock data analysis has received significant attention in the financial literature.
One of the key advantages of using AI in stock data analysis is its ability to process large amounts of data quickly and accurately. This can help analysts identify patterns and trends in the data that might not be immediately apparent to the human eye. For example, Waisi(2020)[27] used AI to analyze OTC stock data and found that it was able to identify patterns that were not detectable using traditional methods. There have also been studies that have examined the use of AI in conjunction with other techniques for OTC stock data analysis. Harries and Horn(1995)[28] used a combination of AI and machine learning to analyze stock data and found that the combined approach was able to achieve higher accuracy compared to either technique alone. Similarly, Hagenau, Liebmann & Neumann (2013)[29] used AI to analyze stock data in conjunction with fundamental analysis and found that the combination was able to improve the accuracy of stock price predictions. One study that examined the effectiveness of data-driven investment strategies was conducted by Helbich et al[30]. The authors used a variety of data-driven techniques, including linear regression and artificial neural networks, to analyze stock price data and found that the data-driven models were able to outperform traditional statistical methods, such as the capital asset pricing model (CAPM).
Existing literature suggests that AI can be an effective tool for OTC stock data analysis, particularly when used in conjunction with other techniques. However, it is important to note that the effectiveness of AI in this context can depend on the specific AI algorithm used and the quality of the data available for analysis.
The impact of data sampling techniques on OTC stock analysis
One aspect of stock analysis that has received attention in the financial literature is the impact of data sampling techniques on analysis results. Data sampling refers to the process of selecting a subset of data from a larger dataset for analysis, and the choice of sampling technique can have a significant impact on the results of the analysis.
One study that examined the impact of data sampling techniques on OTC stock analysis was conducted by Martin, D. (1977).[31] The authors found that using a representative sample of OTC stock data was important for accurate analysis, as non-representative samples may lead to biased results. The authors also found that using a larger sample size generally resulted in more accurate analysis, although the optimal sample size may vary depending on the specific analysis technique used. Other studies have also examined the impact of data sampling techniques on OTC stock analysis. For example, Schoenecker and Swanson (2002).[32] found that using a larger sample size improved the accuracy of technical analysis for OTC stocks. The choice of data sampling technique can have a significant impact on the results of OTC stock analysis. Using a representative sample and a larger sample size are generally recommended to ensure accurate results.
The impact of macroeconomic factors on OTC stock prices
One study that examined the impact of macroeconomic factors on OTC stock prices was conducted by Kao and Shumaker(1999)[33]. The authors found that macroeconomic variables, such as GDP growth and inflation, were significant predictors of OTC stock returns and that the impact of these variables was more pronounced for small-cap stocks. Other studies have also found evidence to support the role of macroeconomic factors in influencing OTC stock prices. Adam and Tweneboah (2008)[34] found that economic growth and interest rates had a significant impact on OTC stock returns, while Roy and Roy (2022)[35] found that inflation and monetary policy were significant predictors of OTC stock prices. However, it is important to note that the impact of macroeconomic factors on OTC stock prices can vary depending on the specific factor and the market conditions. Some studies have found that the relationship between macroeconomic factors and OTC stock prices is more complex and may be mediated by other factors, such as firm-specific characteristics and market conditions [36].
BERT For Fundamental analysis
The BERT model, developed by Google in 2018, is a deep learning algorithm that uses transformers to process and understand natural language. It has been widely used in various NLP tasks, including language translation, question answering, and sentiment analysis. The BERT model is based on the transformer architecture, which was introduced by Vaswani et al.(2017)[37]. The transformer architecture uses self-attention mechanisms to process input sequences in parallel rather than sequentially, as in traditional recurrent neural networks (RNNs). This allows for faster processing and improved performance in tasks such as language translation. The BERT model uses a multi-headed self-attention mechanism, in which the input sequence is split into multiple “heads”, and each head attends to a different part of the sequence. The output of the self-attention mechanism is then passed through a feedforward neural network and transformed into a final representation of the input sequence.
The BERT model also uses a “masked language model” training technique, in which some of the words in the input sequence are randomly masked, and the model is trained to predict the original words based on the context provided by the other words in the sequence. This allows the model to learn contextual relationships between words, which is important for tasks such as financial corpora classification, language translation and question answering.
In the context of fundamental analysis, the BERT model can be used to analyze company earnings calls, press releases, and other textual data to extract insights and make predictions about a company’s performance. One study by Chava et al(2022).[38] used the BERT model to analyze earnings call transcripts and found that it was able to accurately predict stock price movements. The study found that the BERT model was able to identify positive and negative sentiment in the transcripts and accurately predict the direction of stock price changes. This suggests that the BERT model can be a useful tool for investors looking to make informed decisions based on the content of earnings calls.
Other research has also demonstrated the effectiveness of the BERT model in fundamental analysis. A study by Schumaker and Chen(2009).[39] used the BERT model to analyze company press releases and found that it was able to accurately predict stock price movements. The study found that the BERT model was able to identify positive and negative sentiment in press releases and accurately predict the direction of stock price changes.
Deep Attention Layer
Deep attention layers, also known as attention mechanisms, have been widely studied and implemented in various fields, such as natural language processing, computer vision, and speech recognition. Attention mechanisms enable a model to focus selectively on certain input elements while processing, allowing for a more efficient and accurate representation of the input data.
One of the earliest proposed attention mechanisms was the Encoder-Decoder attention model introduced by Bahdanau et al. in 2014[40]. This model was applied to machine translation tasks, where the encoder processes the input sequence and the decoder generates the output sequence. The attention model allows the decoder to attend to specific parts of the encoded input sequence at each time step, improving translation quality.
Later, attention mechanisms were extended to image classification tasks. In 2016, Yang et al.[41]. proposed the Stacked Attention Networks (SAN) model, which uses multiple attention layers to focus on different regions of the input image at different scales. The SAN model achieved superior performance on the Image Question Answering model benchmark compared to previous state-of-the-art models.
In the field of natural language processing, the Transformer model introduced by Vaswani et al. in 2017[37] has become widely popular due to its effectiveness in tasks such as machine translation and language modelling. The Transformer model utilizes self-attention layers, which allow the model to attend to all input elements simultaneously while processing. This allows the model to capture long-range dependencies in the input data and achieve superior performance on tasks such as language translation.
There have also been efforts to incorporate attention mechanisms into speech recognition tasks. In 2022, Li[42]. Proposed the Attention-based Encoder-Decoder (AED) model, which uses attention layers to focus on specific parts of the input audio signal during encoding and decoding processes. The AED model was able to achieve significant improvements in speech recognition accuracy compared to previous models.
One of the main benefits of attention layers is their ability to handle long sequences of data, which is often a challenge for recurrent neural networks (RNNs). RNNs process input data sequentially, with each time step, depending on the previous time step. As the length of the input sequence increases, the computational complexity and memory requirements of RNNs also increase, leading to the so-called “vanishing gradient” problem, where the gradients of the parameters become very small and the model is unable to learn effectively. Attention mechanisms provide a way to alleviate this problem by allowing the model to focus on the most relevant parts of the input data at each time step, rather than processing the entire input equally.
There are several different types of attention mechanisms, each with its own set of advantages and limitations. Some of the most commonly used attention mechanisms are:
Scaled Dot-Product Attention
The Scaled Dot-Product Attention (SDPA) is a key component of transformer-based neural network architectures, which have gained widespread popularity in natural language processing (NLP) tasks. The SDPA allows the transformer to efficiently process and understand the relationship between different input sequences by calculating the importance of each element in the sequence.
The SDPA is defined mathematically as follows:

where ![]() and
and ![]() are weight matrices, and d is the dimensionality of the key and query vectors. The attention score is then used to calculate the attention weights for each element in the input sequence:
are weight matrices, and d is the dimensionality of the key and query vectors. The attention score is then used to calculate the attention weights for each element in the input sequence: ![]() and
and ![]() are weight matrices, and d is the dimensionality of the key and query vectors. The attention score is then used to calculate the attention weights for each element in the input sequence:
are weight matrices, and d is the dimensionality of the key and query vectors. The attention score is then used to calculate the attention weights for each element in the input sequence:
![]()
The attention weights are then used to calculate the output of the SDPA, which is a weighted sum of the input sequence:
![]()
The SDPA has been widely used in transformer-based models for NLP tasks, such as machine translation, language modeling, and question answering. Research has shown that the SDPA is effective at capturing the dependencies between different elements in the input sequence, which is essential for accurately processing and understanding natural language.
One study by Vaswani et al. (2017)[37] demonstrated the effectiveness of the SDPA in machine translation tasks. The study found that the SDPA was able to significantly improve translation accuracy compared to traditional attention mechanisms. Another study by Ma et al(2019).[43] used the SDPA in a transformer-based model for language modeling and found that it was able to achieve state-of-the-art performance on several benchmarks.
Multi-Head Attention
The Multi-Head Attention (MHA) mechanism is a key component of Transformer-based models, which have recently gained popularity in the field of natural language processing (NLP). MHA allows a model to attend to multiple input representations simultaneously, enabling it to capture complex dependencies between input elements.
Mathematically, MHA can be represented as a weighted sum of the input representations, where the weights are calculated using a dot product attention mechanism. Specifically, given a set of input representations Q, K, and V, the MHA mechanism calculates the attention weights as follows:
![]()
where d_k is the dimensionality of the key representations.
The MHA mechanism has been shown to improve the performance of NLP tasks such as machine translation, question answering, and language modeling. For example, Vaswani et al. (2017)[37] used MHA in the Transformer model and demonstrated its effectiveness on machine translation tasks. Similarly, ibid used MHA in the BERT model and showed its ability to achieve state-of-the-art results on a variety of NLP tasks.
However, MHA has also been criticized for its high computational complexity, which can make it difficult to scale to large datasets. To address this issue, researchers have proposed various approaches to improve the efficiency of MHA, such as using sparsity-inducing techniques Zhang et al[44] and approximating the attention weights using low-rank decompositions Chen et al (2021).[45]
Self-Attention
This mechanism is a variant of the attention mechanism that allows the model to attend to its own output at each time step, rather than only attending to the input data. This allows the model to capture dependencies between different parts of the output sequence, and to generate more coherent output. Self-attention has been widely used in models for language modeling and machine translation, where it has been shown to improve the quality of the generated output.
Kivy
Kivy is an open-source Python library for creating graphical user interfaces (GUIs). It is designed to be cross-platform and run on multiple devices, including smartphones, tablets, and desktop computers. Kivy has gained popularity in recent years for its simplicity, flexibility, and performance.
One of the main advantages of Kivy is its ability to create responsive and interactive GUIs. Kivy uses a declarative approach, where the developer specifies the layout and behavior of the GUI elements, and the library handles the rendering and event handling. This allows developers to easily create complex and dynamic GUIs without having to worry about the low-level details. Kivy also has a wide range of built-in widgets and layout managers, which can be customized and extended to meet the specific needs of the application. It also includes support for various input methods, such as touch, mouse, and keyboard, which makes it suitable for a wide range of devices and platforms.
In addition to its use in scientific and technical applications, Kivy has also been used in a wide range of other fields, including education, gaming, and entertainment. For example, a study by Wilson. (2013).[46] used Kivy to create an interactive educational game for children, and found that it was able to effectively engage and educate the players.
Tensorflowlite
TensorFlow Lite is an open-source software library for machine learning that enables on-device training and inference for mobile, embedded, and Internet of Things (IoT) devices. It is designed to be lightweight and efficient, allowing developers to build and deploy machine learning models on devices with limited computational resources.
Luo et al[47] evaluated the performance of TensorFlow Lite on mobile devices and found that it was able to achieve competitive accuracy and performance compared to other mobile machine-learning frameworks. The study also found that TensorFlow Lite was able to run efficiently on devices with limited computational resources, making it an attractive option for mobile applications. Tran et al[48] used TensorFlow Lite to develop a deep learning model for predicting patient outcomes in a healthcare setting. The study found that TensorFlow Lite was able to achieve high accuracy and efficiency, making it a promising tool for building machine learning models in the healthcare industry.
Other research has also demonstrated the effectiveness of TensorFlow Lite in a variety of applications. TensorFlow Lite is an efficient tool for building and deploying machine learning models on mobile, embedded, and IoT devices. It has been widely used in a variety of applications and has demonstrated strong performance and accuracy.
Methodology
This project involves a complex infrastructure having multiple components. I have divided the project into 4 major parts:
Data collection and preprocessing:
For this project, Data collection was done for both fundamental and technical analysis models, for the fundamental analysis models, the data used was collected from the Financial Sentiment Analysis dataset on kaggle. The dataset contains 5842 rows × 2 columns ; news and sentiment.
Not much preprocessing was done on the data for fundamental analysis, only the encoding with the regular_encode function: this function encodes a given list of text corpora with an instance of tokenizer given. It is used to encode training and test data.
OTC Markets Group is a financial market data provider that offers real-time and historical data on over-the-counter (OTC) stocks through its API. The OTC Markets API allows users to access data on OTC market trends, stock quotes, trading volume, and other financial metrics. Data collection through the OTC Markets API involves accessing the API through a Python script using API calls to retrieve the OTC stocks data from 2021-10-26 08:17 to 2022-10-31 14:05. The API provides various endpoints for data collection, including market data, company data, and insider trading data. with the market data endpoint, we retrieved data on stock quotes, trading volume, and market trends, while the company data endpoint allows users to access information on a specific company’s financial statements, management, and industry conditions. for the collection of historical data, 3 functions were written for three data endpoints from OTCmarkets API:
- getbadgesDetails
- getStocksList
- get_AS_OS_details
The getstockslisted function gets all available stocks on OTCmarkets API, after which the other two functions get appropriate fields on listed stocks. the following fields of data were obtained: ‘Notification’, ‘Timestamp’,’Symbol1′,’NewValue’,ActiveStatusUpdated’,’Agent_Profile_Status’,’Authorized_Shares’ ‘BotName’,’BotType’,’Company’,’CompanyActiveStatus’,’IsBankrupt’,’IsCaveatEmptor’,’IsDark’,’IsDelinquent’,’IsPennyStockExempt’,’IsShell’,’IsShellRisk’,’Market’,’NewData’,’NewFilingURL’,’OldData’,’Outstanding_Shares’,’Price’, ‘Profile_Status’, ‘SOS_Site’, ‘Symbol’, ‘TA_VerifiedDate’
Once the data has been collected, it is important to perform preprocessing in order to clean and prepare the data for analysis. Preprocessing involves a series of steps to transform the raw data into a form that can be easily analyzed. This includes removing missing rows, deleting invalid columns, standardizing data types and formats, and normalizing data values.
For preprocessing the collected OTC stocks dataset:
- The collected data was badly formatted, with 37084 rows and 5 columns with the last one containing the entry’s metadata: Notification, Timestamp, Symbol, NewValue, OtherData.
- The OtherData contains a JSON of other properties of the data entry like the price and volume of a Security.
- I renamed the files from a .csv extension to a .txt extension so i can freely make string manipulations during data processing.
- I extracted the columns from the OtherData JSON entries with the Process_entries and Getfields functions I wrote specifically for that.
- The get fields function loops through the stockslist.txt data and extract all fields shared by all securities for processing, this is because there were some flag variables unique to certain securities, whose values are unknown for the other securities, the process entries then sort the returned fields and sends them to be saved in the newly created pandas dataframe for processed values.
- Having done this, I looped through all fields for the following process:
- encoded every categorical data fields with a dictionary object, I did not use Label encoder because I did this encoding column-wise
- for every field with continuous data entry, I inspected and replaced the commas and full stops with empty strings then redefined the Data Types from pandas objects to int64
- I sorted the dataframe by stocks and timestamp.
- I plotted a long frequency-security barchart to visualize the number of observations for each security:
- I dropped entries for securities less than a threshold of 20 samples
- I then bucketed the available stocks security with observations above the given threshold
- I re-ordered each security bucket in the dataset to have a start and a target time using a one to many approach, for every entry in the security bucket, every another observation at a later time to the entry is selected and the distance between variables of the source to target selection is calculated except for the categorical variables which are concatenated with rows in the bucket the target price is then appended to the end of the row
- With this the technical analysis with machine learning was presented as a regression problem of predicting future prices with current market conditions and state
- I then merged the buckets after which i did a correlation plot on the now re-ordered dataset:
- On inspection from the correlation plot, I dropped a number of columns based on their correlation scores with the target price( threshold= -0.1 to+0.1 and as a result, the following columns were dropped:
- I also dropped every one of two perfectly correlated columns present in the dataset.
- The technical analysis models were then trained on this data.
Technical analysis model development:
The Long Short-Term Memory (LSTM) and Temporal Convolutional Neural Network (TCNN) models are machine learning algorithms that have been widely used in the field of stock market technical analysis. Both models are designed to process and analyze time series data, making them particularly useful for analyzing financial data. The LSTM model is a type of recurrent neural network that is able to process and analyze sequential data by maintaining a “memory” of previous input. This allows the model to learn and make predictions based on the long-term dependencies within the data. The LSTM model has been widely used in a variety of applications, including stock market prediction, language translation, and speech recognition. The TCNN model is a type of convolutional neural network that is able to process and analyze temporal data by using convolutional filters to extract features from the data. The TCNN model is particularly useful for analyzing data with a strong temporal component, such as financial data, as it is able to identify patterns and trends over time. for the technical analysis, an LSTM model and a TCNN model were both trained in a regressive approach in comparison to a simple MLP baseline model; details on model development and evaluation follows in the following chapter.
Fundamental analysis model development
For OTC Markets financial news sentiment analysis, I trained two models, a BERT transformer layer and a finBERT that I fine tuned to financial news for analyzing financial news articles and extracting insights about the sentiment of the news. By analyzing the language and context of the articles, the models were able to identify a positive or negative sentiment and make predictions about the impact of the news on the stock market.
Model deployment and GUI development.
TensorFlow Lite is an open-source software library for machine learning that enables on-device training and inference for mobile, embedded, and Internet of Things (IoT) devices. It is designed to be lightweight and efficient, allowing developers to build and deploy machine learning models on devices with limited computational resources. Kivy is an open-source Python library for building cross-platform graphical user interfaces (GUIs). It is often used in combination with TensorFlow Lite to build and deploy machine learning models on mobile and embedded devices. To deploy trained models with TensorFlow Lite and Kivy, I converted the model to a TensorFlow Lite model: TensorFlow Lite models are optimized for deployment on mobile and embedded devices. I then built the GUI with Kivy: the GUI design was a single screen minimalistic design with 5 major windows:
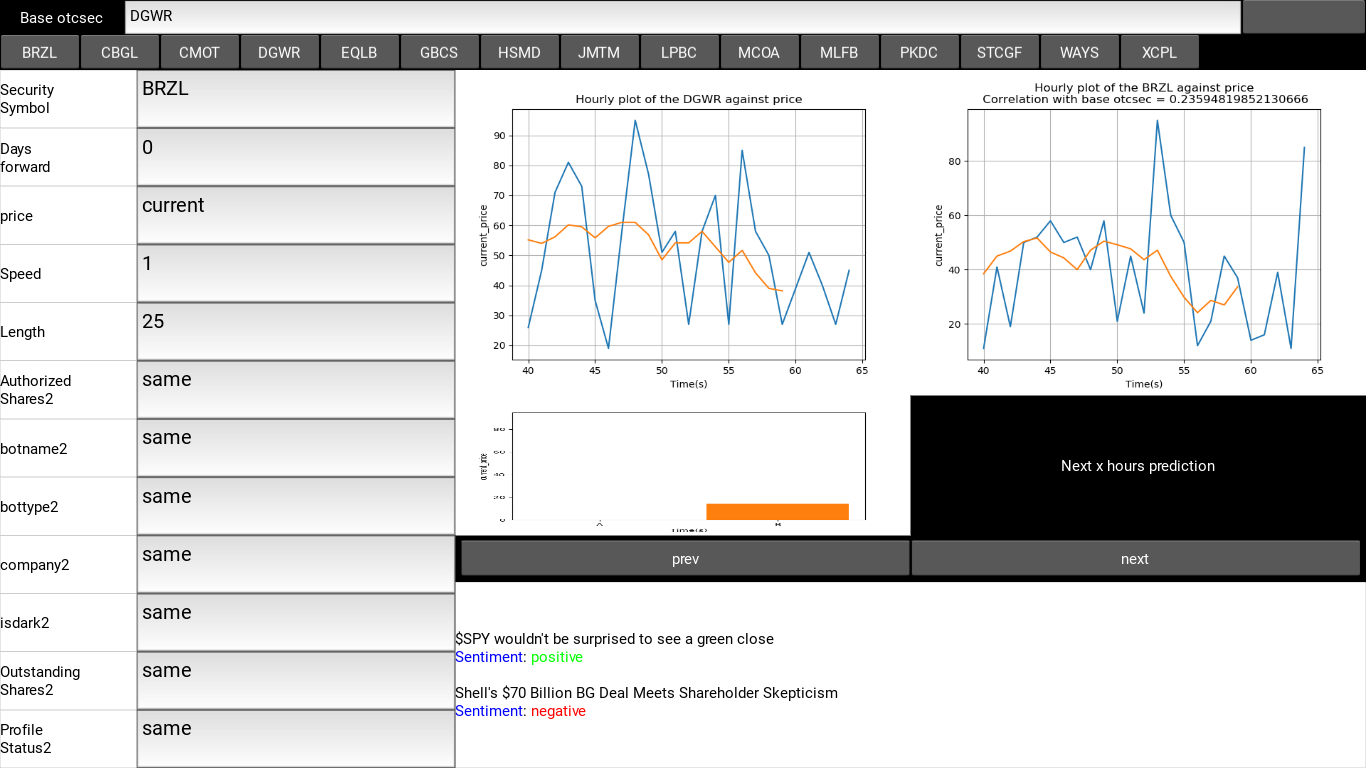
Fig 2.1. A snap shot of the kivy GUI with annotations of the five main sections.
as said earlier, the GUI consists of 5 windows:
- The header Bar:
this is the topside window in the GUI, it houses the Base token variable setter and the security selector scrollable list, with this the user can set a base security in the first price plot window and select one of the securities plotted in the second price plot window. in the security list, there are 15 Securities namely: [‘BRZL’, ‘CBGL’, ‘CMOT’, ‘DGWR’, ‘EQLB’, ‘GBCS’, ‘HSMD’, ‘JMTM’, ‘LPBC’, ‘MCOA’, ‘MLFB’, ‘PKDC’, ‘STCGF’, ‘WAYS’, ‘XCPL’].
Fig 2.2. A snapshot of the header, showing the positions of the mentioned Base security and list of securities used in this project.
- The sidebar:
As discussed earlier, this houses all the control variables for the technical analysis system. The GUI contains a side bar that houses all the models control variables giving a chance to test out “what if” related strategies. the control variables are:
Table 2.1: List of control variables for the GUI
Each variable is binded to an on enter keypress that updates the prediction window when values have been updated.
- The price plot window:
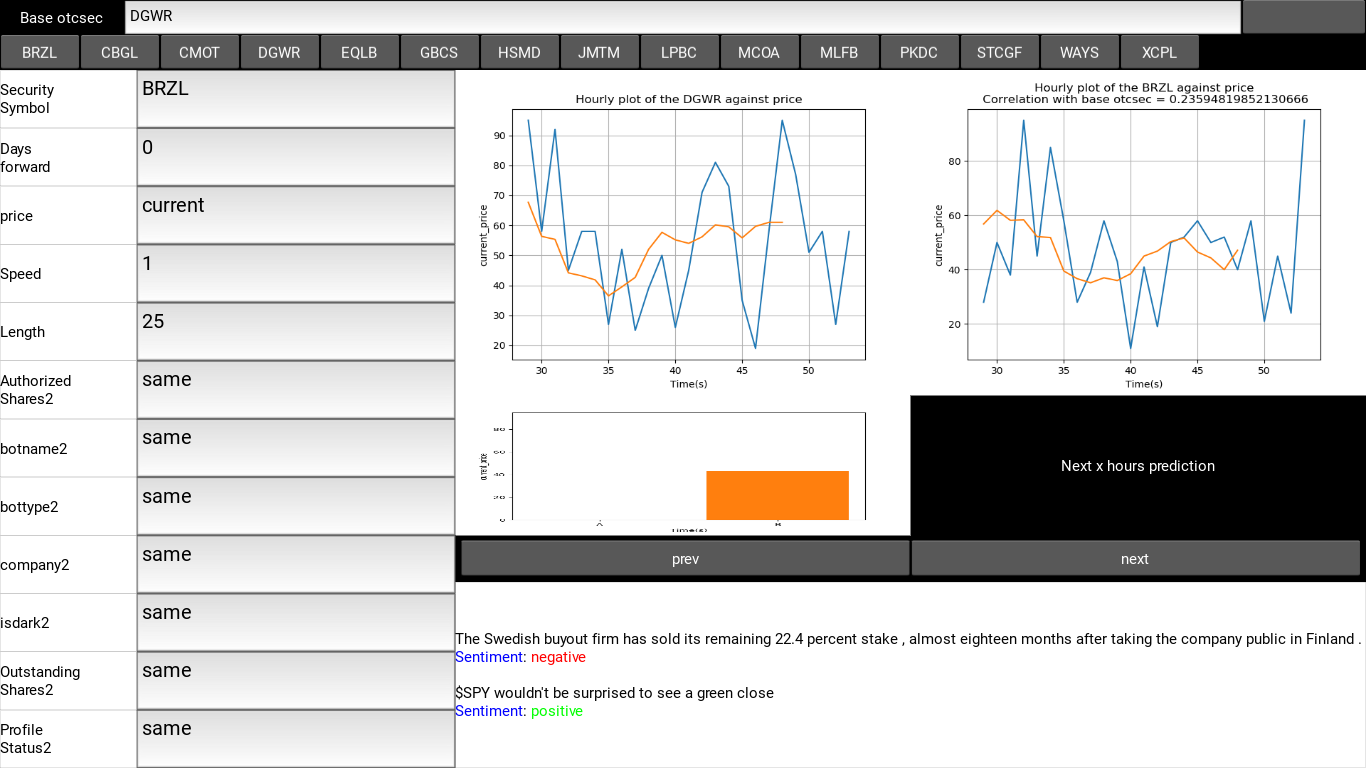
These are non-static visualization plots implemented in matplotlib for monitoring the price movement in real time. due to access problems, I have used a pseudo real time version of the dataset used for the technical analysis in this model, pipelining data directly into the model from OTC markets has limited access and at times does not return any result, this may break the system in time and thus for testing, I resulted to using this alternative. The price plot window contains 2 windows for visualizing 2 separate securities, each plot is a moving plot of the price values of each security against time. at the top of the of the plots there is a correlation score to determine the effect of the price movement of selected security A on the Base Security B
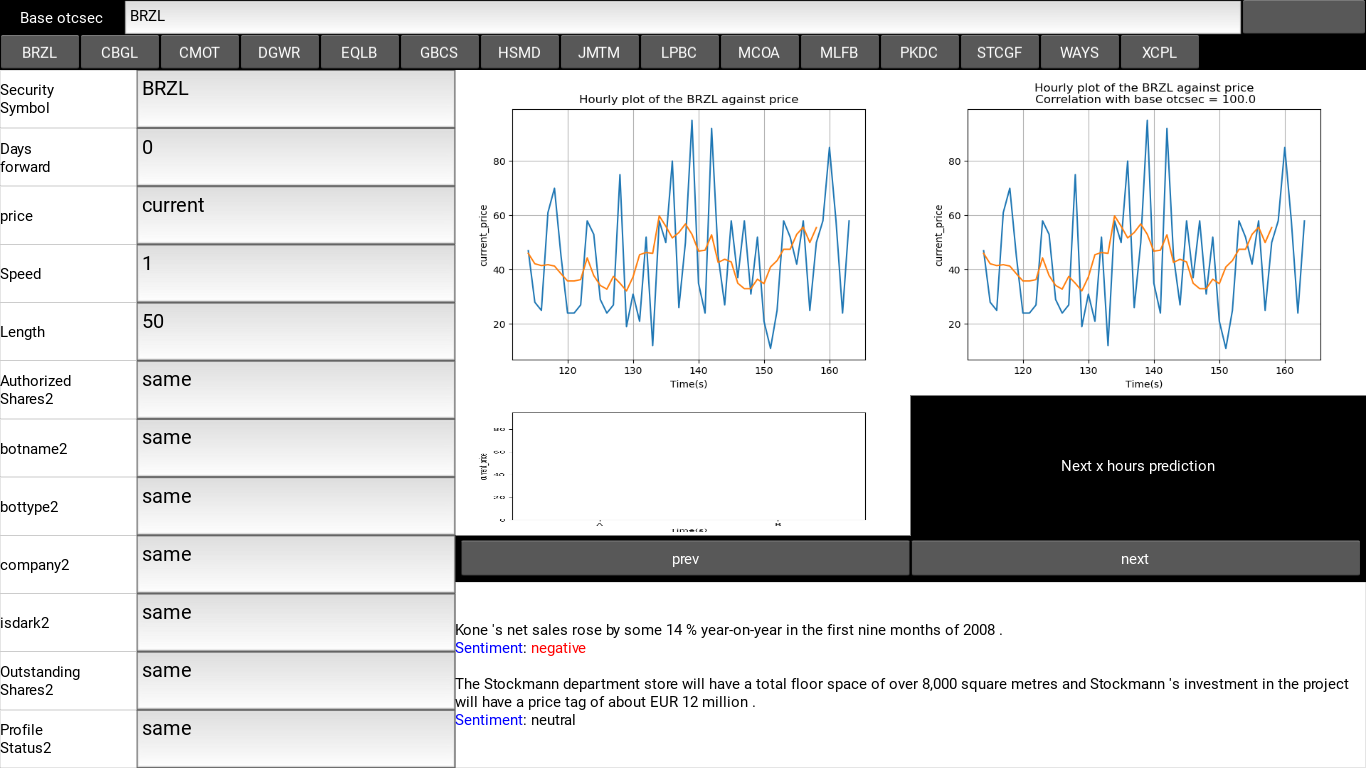
Fig 2.3: A snapshot of the price plot window
- Prediction window:
this is the display window for price prediction when any control variable has been updated through the side bar, the system simply scans for changes in any of the control variables and updates the prediction window to display the predicted price value for the given conditions. the prediction price window contains an histogram for displaying the prospective profit should the prediction be accurate.
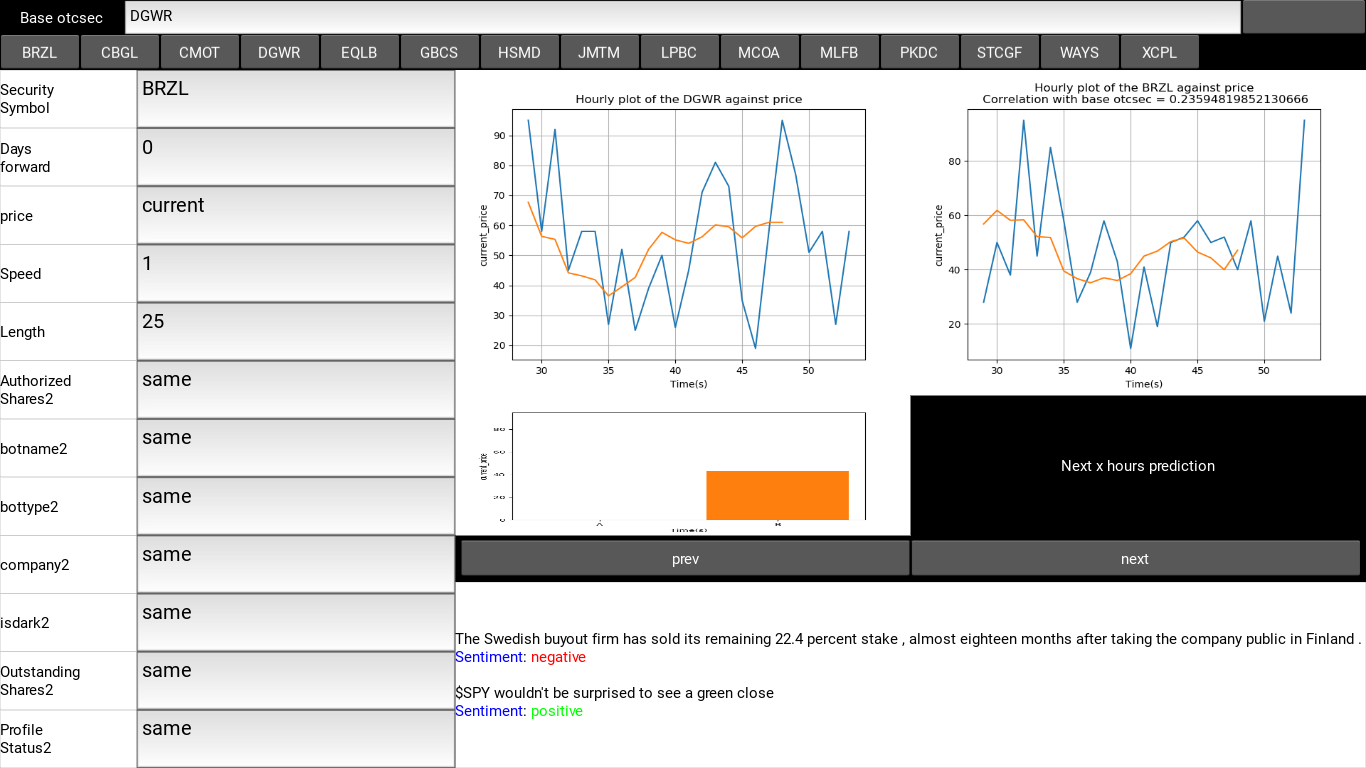
Fig 2.4. A snapshot of the prediction window.
- Fundamental analysis signals:
As observed in the figure aboveThe fundamental signals analysis simply displays analyzed news results and the financial sentiments attached to them for fundamental analysis.
With these, the system was able to generate signals relating to buy and sell signals depending on the pipeline’s predictive output.
I then tested the model and GUI.
Software Architecture
Following are the resources required to develop the software:
Programming Language: Python and kv language
Signals Pipeline: Python automation scripts
Database: The Excel CSV files
Training and Prediction Pipeline: Google Colab
for the software architecture, following the design in the proposal,
OTC Data Acquisition
Historical data
Real-time news
Fig 2.5. The Prediction pipeline
Model design and development.
LSTM design and development; Overview of the Architecture.
Long Short-Term Memory (LSTM) is a type of Recurrent Neural Network (RNN) architecture that is able to effectively capture long-term dependencies in sequential data as stated earlier. It was developed to address the problem of vanishing gradients in traditional RNNs, which makes it difficult for the network to learn long-term dependencies. The LSTM architecture consists of a series of cells that are connected in a sequential manner. Each cell has three input gates, three output gates, and a forget gate. These gates are used to control the flow of information into and out of the cell.The input gate controls the flow of input data into the cell. It is calculated using the following equation:
![]()
where ![]() is the input data, h is the hidden state of the previous time step,
is the input data, h is the hidden state of the previous time step, ![]() and
and ![]() are the weights and biases of the input gate, and σ is the sigmoid activation function.
are the weights and biases of the input gate, and σ is the sigmoid activation function.
The forget gate controls the flow of information out of the cell. It is calculated using the following equation:
![]()
where ![]() and
and ![]() are the weights and biases of the forget gate.
are the weights and biases of the forget gate.
The output gate controls the flow of information out of the cell to the next time step. It is calculated using the following equation:
![]()
where ![]() and
and ![]() are the weights and biases of the output gate.
are the weights and biases of the output gate.
The cell state is updated using the following equation:

where ![]() and
and ![]() are the weights and biases of the cell state, and Tanh is the hyperbolic tangent activation function.
are the weights and biases of the cell state, and Tanh is the hyperbolic tangent activation function.
The hidden state is then calculated using the following equation:
![]()
Finally, the output of the LSTM architecture is calculated using the following equation:
![]()
where ![]() and
and ![]() are the weights and biases of the output layer.
are the weights and biases of the output layer.
LSTM model development:
To develop an LSTM model for otc stocks I Installed and imported Tensorflow and other required libraries: I used Tensorflow and Keras
The model, consists of 8 units of LSTM cells,3 Dense network layers connected in series with 603 parameters.it was compiled with the following hyperparameters:
loss=’mean_squared_error’, optimizer=tf.keras.optimizers.Adam(learning_rate=1e-2),metrics = [‘mean_absolute_error’]
model training was a 12GB RAM google colab runtime with no software accelerator or performance enhancers like GPUS and TPUS. the trained model is very light weight, 282kb
Fig 2.6. the LSTM Network
TCNN model development; Overview of the architecture
The TCNN (Temporal Convolutional Neural Network) model architecture is a type of neural network that is specifically designed to process sequential data, such as time series data or natural language. It combines the benefits of both convolutional neural networks (CNNs) and recurrent neural networks (RNNs). The TCNN model consists of a series of convolutional and pooling layers, followed by a series of temporal convolutional layers. The temporal convolutional layers are responsible for processing the temporal dependencies in the data, allowing the model to capture patterns and trends over time.
Mathematically, the TCNN model can be represented as follows:
Convolutional layers:
![]()
![]()
Where ![]() represents the convolution operation,
represents the convolution operation, ![]() are the weights and biases of the layer, and f is the activation function.
are the weights and biases of the layer, and f is the activation function.
Pooling layers:
![]()
![]()
Where ![]() is the pooling function (e.g. max pooling).
is the pooling function (e.g. max pooling).
TCNN model architecture allows for the efficient processing of sequential data, making it well-suited for tasks such as time series prediction like the OTCstocks market price prediction.
TCNN model development
Similar to the LSTM model, To develop a TCNN model for the otc stocks, I imported the required libraries first, then I tested out different depth configurations for the TCNN model the best performing model contains 2 conv1d layers, a max pooling layer and a dense layer with a linear activation function.
The TCNN model has 106 parameters which is way less than the parameters of the LSTM model, about six times reduction in size and parameters, that would bear greatly on model performance on edge devices. the model was compiled with the following hyper parameters:
loss=’mean_squared_error’, optimizer=tf.keras.optimizers.Adam(learning_rate=1e-2),metrics = [‘mean_absolute_error’]. below is the model summary for the TCNN model:
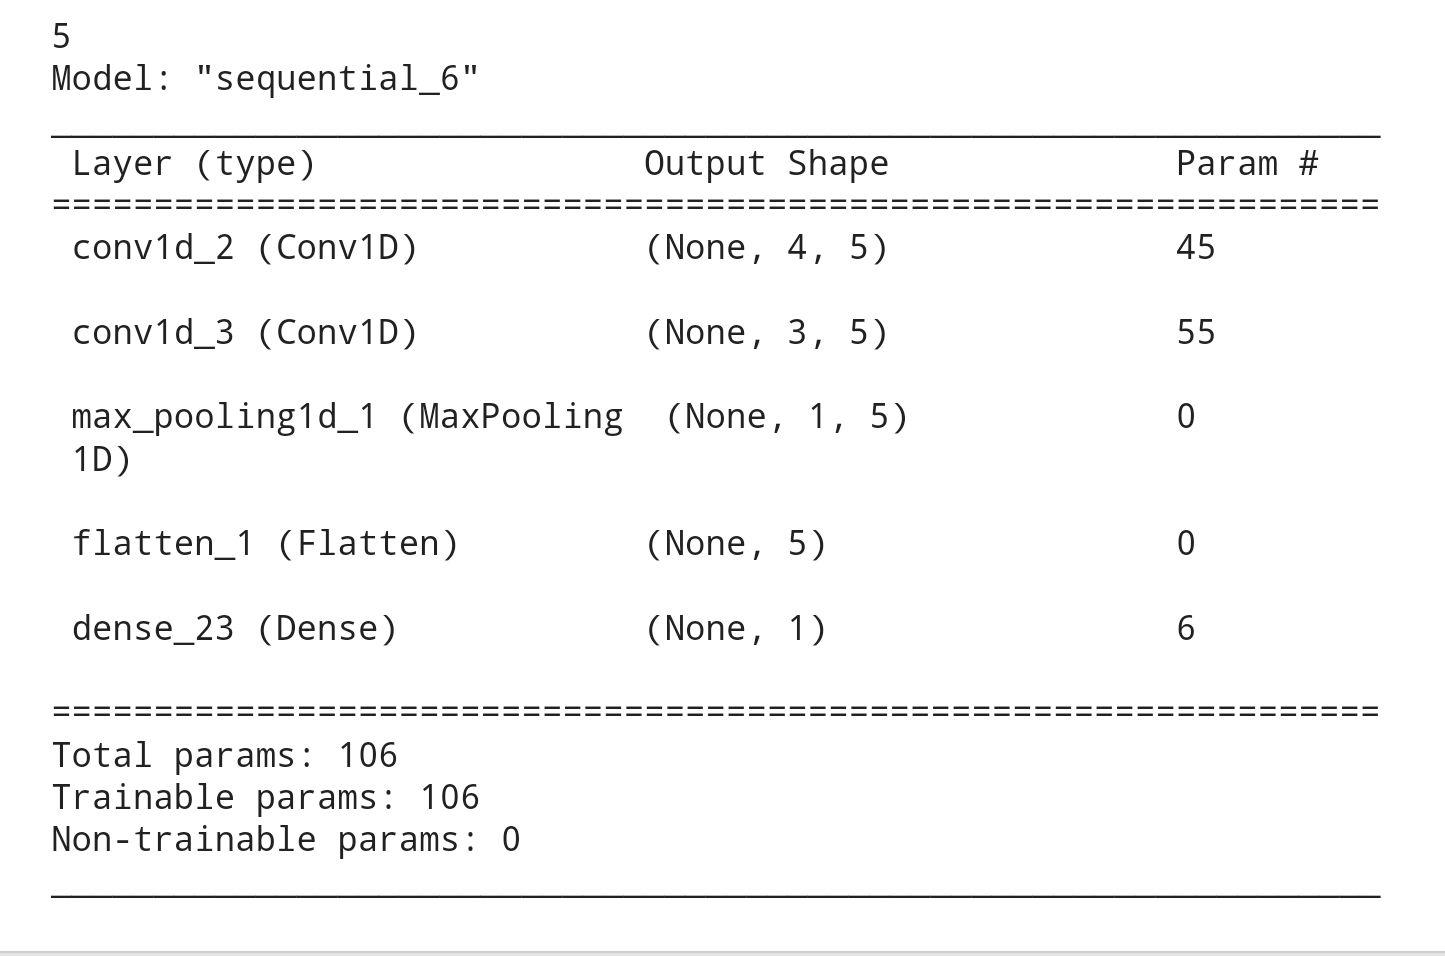
Fig 2.7. TCNN model architecture
Overview of the BERT architecture:
BERT (Bidirectional Encoder Representations from Transformers) is a transformer-based neural network architecture for natural language processing tasks such as language understanding and language generation.
The architecture of BERT consists of multiple layers of self-attention mechanisms and feed-forward neural networks, with the self-attention layers being the core component of the model. The self-attention mechanism allows the model to weigh the importance of different words in the input sentence, allowing it to focus on the most relevant information when processing the sentence.
The basic building block of BERT is the transformer, a type of neural network layer that uses self-attention to process the input data. The transformer takes in a sequence of input tokens (e.g., words or subwords) and produces a new sequence of output tokens. In BERT, the transformer is applied multiple times to the input data, with each application allowing the model to learn increasingly complex representations of the input.
The input to the BERT model is a sequence of tokens (e.g., words or subwords), which is first passed through an embedding layer to convert the tokens into continuous vector representations. These vector representations are then passed through multiple layers of transformer blocks, where the self-attention mechanisms are applied to the input. The output of the final transformer block is then passed through a feed-forward neural network, which produces the final output of the model.
BERT model architecture
In addition to the standard transformer architecture, BERT also introduces a novel pre-training objective called the masked language modeling (MLM) objective. In this objective, some of the tokens in the input sentence are randomly replaced with a special [MASK] token, and the model is trained to predict the original token based on the context provided by the rest of the sentence. This allows the model to learn contextual relationships between words in the input sentence, as well as the likelihood of different words appearing in a given context. for thee fundamental analysis, two models were developed:
- A Non-Pretrained Transformer layer
- A Pre Trained FinBERT from Prosus AI
Pretrained BERT model development:
Having collected the labeled news dataset and done the train – test split after shuffling the entire dataset, for the classification task. I selected Prosus AI’s pretrained finBERT model as the base for my classification model, FinBERT is a pre-trained NLP model to analyze sentiment of financial text. It is built by further training the BERT language model in the finance domain, using a large financial corpus and thereby fine-tuning it for financial sentiment classification. Financial PhraseBank by Araci (2019)[49].
I used the pre-trained BERT model to perform feature extraction on the collected dataset after tokenization with the corresponding tokenizer with the following parameters:
EPOCHS =6
# number of training epochs
BATCH_SIZE = 100 # batch size
MAX_LEN = 100 # maximum length of sequence
MODEL = ‘ProsusAI/finbert’
Using the pre-trained BERT model to encode the input features of each example in the dataset into a set of fixed-length vectors. I then added a fully connected layer on top of the BERT-encoded features. The fully connected layer takes the BERT-encoded features as input and outputs a probability distribution over the possible labels. I defined a loss function of Categorical cross entropy for the three label dataset:
- positive sentiment
- neutral sentiment
- negative sentiment
and an Adam optimizer was used for the model.
Train your model by feeding it the labeled examples in your dataset, and updating the model parameters based on the gradients of the loss function.
I then trained the model with the test split as validation data. model performance was evaluated with the accuracy metric. the model was compiled with the following parameters:
optimizer=Adam(lr=1e-5),
loss=”categorical_crossentropy”, metrics=[“accuracy”]
the FinBERT has 109,484,547 parameters and is relatively large in size, below is a model summary:
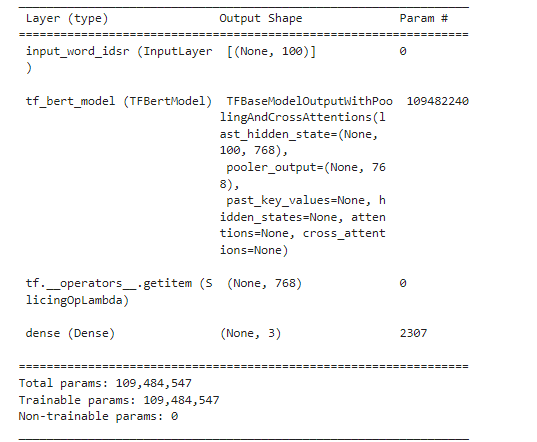
Fig 2.8. The FinBERT model Architecture.
Transformer layer model development
The transformer layer model is a non-pretrained BERT classification built from scratch to classify text data. It is not pre-trained on any external data sets and relies solely on the Financial news data provided for training. The model consists of several layers, starting with the input layer where the text data is fed into the model. The input data is tokenized and embedded, which means that each word in the text is represented by a numerical vector.
The next layer is the encoder layer, which is made up of multiple transformer blocks, each transformer block contains:
Multi-head self-attention: This mechanism allows the model to weigh the importance of different words in the input when making predictions. The model can attend to different parts of the input in parallel, allowing it to understand relationships between words that are far apart in the text.
Position-wise feed-forward network: This component is a simple neural network that processes the output from the self-attention layers. It helps the model learn to make predictions based on the entire input.
Layer normalization: This is a technique for normalizing the output of the self-attention and feed-forward layers, which helps to stabilize the training process.
The transformer blocks are responsible for encoding the input data and creating a representation that captures the context and meaning of the text.
After the encoder layer, there is a pooling layer that extracts the most important features from the encoded text. These features are then passed to the final classification layer, which is a fully connected layer. This layer uses the extracted features to make a prediction about the class of the input text.
Finally, the model is trained using a supervised learning algorithm rather than the self-supervised training approach for Transformer models. for this model also, there’s neither Masked Language Modeling and Next Sequence Prediction to learn the weights and biases of the model.
the transformer layer model has 1183059 parameters, below is the model summary:
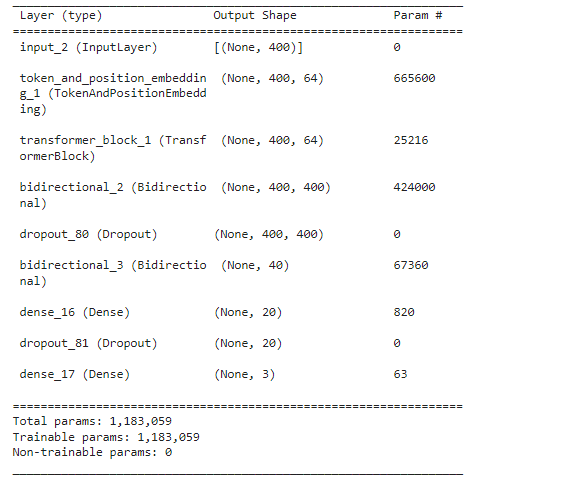
Fig 2.9. Transformer layer architecture
Results and Discussion
For this project, 5 models were developed in total with different architectures, initialized parameters and layers. While the models have two categories, one for fundamental analysis and another for technical analysis, all training results will be discussed in this section. Architecture and models of all experiments can be found in the project file.
LSTM model Evaluation:
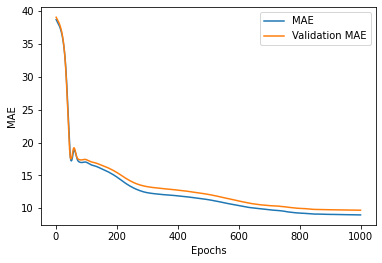
below are the first 2 and last 2 training epochs for the LSTM model for price prediction:
| Epoch/1000 | Loss | Val
Loss |
MAE | Val
MAE |
| 1 | 1899.7 | 1967.4 | 38.499 | 38.92 |
| 2 | 1898.2 | 19.65.9 | 38.479 | 38.900 |
| 999 | 170.33 | 193.65 | 9.0437 | 9.4218 |
| 1000 | 175.47 | 195.56 | 9.1670 | 9.4663 |
Table 3.1: metrics evaluation for the LSTM training epochs
The following loss and MAE plots were obtained: 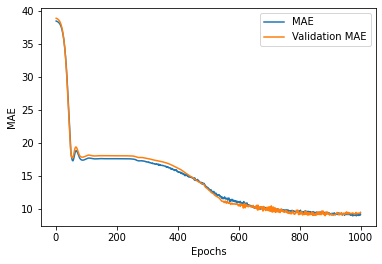
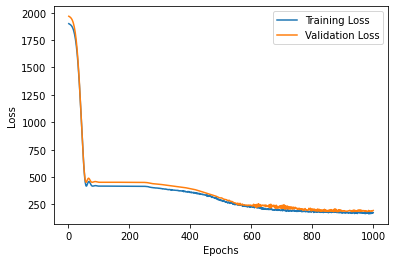
Fig 3.1. (a) a training and validation loss vs epochs plot for the lstm prediction model (b)a training and validation MAE vs epochs plot for the lstm prediction model
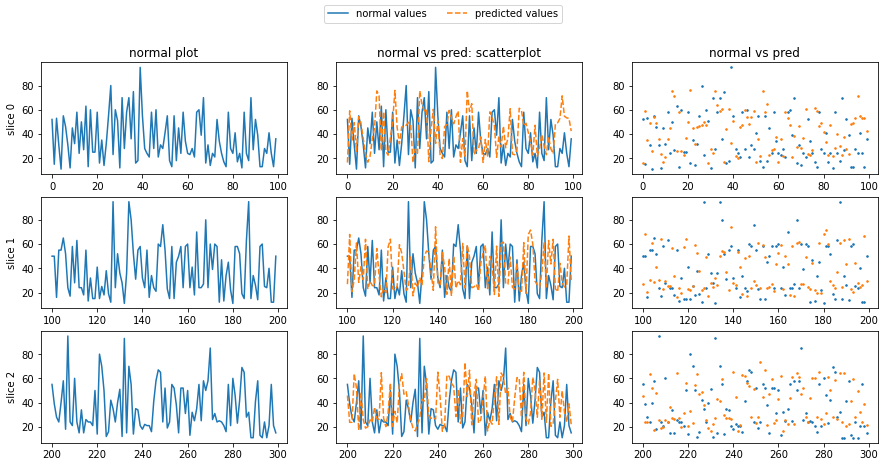
Fig 3.2. column 1 contains plots of randomly sliced price values for a randomly chosen security, column 2 contains the LSTM predictions for the values superimposed on the actual values. column 3 contains scatterplots of column 2.
TCNN model Evaluation:
below are the first 2 and last 2 training epochs for the TCNN model for price prediction:
| Epoch/1000 | Loss | Val
Loss |
MAE | Val
MAE |
| 1 | 1916.2 | 1978.7 | 38.717 | 39.069 |
| 2 | 1909.0 | 1971.6 | 38.625 | 38.981 |
| 999 | 166.98 | 194.72 | 9.0028 | 9.7132 |
| 1000 | 166.96 | 194.58 | 8.9982 | 9.7153 |
Table 3.2: metrics evaluation for the TCNN training epochs
The following loss and MAE plots were obtained:
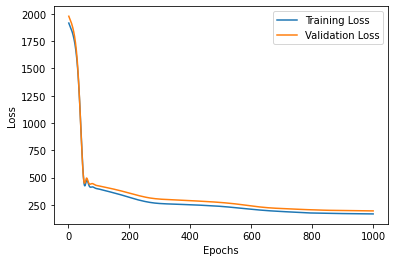
Fig 3.3. (a) a training and validation loss vs epochs plot for the TCNN prediction model (b)a training and validation MAE vs epochs plot for the TCNN prediction model
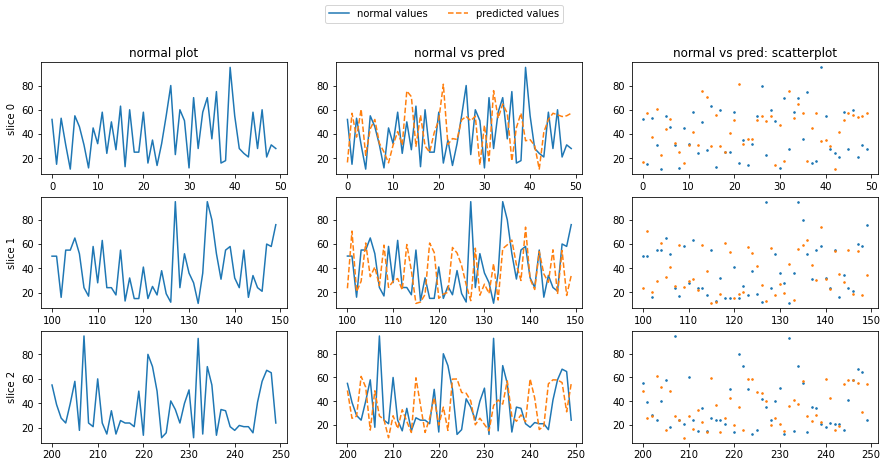
Fig 3.4. column 1 contains plots of randomly sliced price values for a randomly chosen security, column 2 contains the TCNN predictions for the values superimposed on the actual values. column 3 contains scatterplots of column 2.
Pretrained FinBERT model evaluation
below are the first 2 and last 2 training epochs for the TCNN model for price prediction:
| Epoch/2 | Loss | Val
Loss |
Acc
score |
Val
Acc |
| 1 | 0.6925 | 0.4061 | 0.6840 | 0.8043 |
| 2 | 0.3997 | 0.3732 | 0.8154 | 0.8146 |
Table 3.3: metrics evaluation for the FinBERT finetuning epochs
the following loss and accuracy plots were obtained:
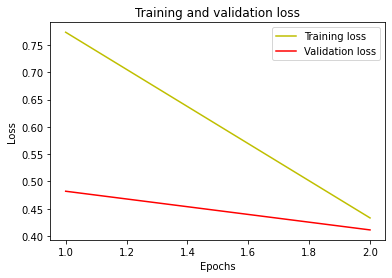
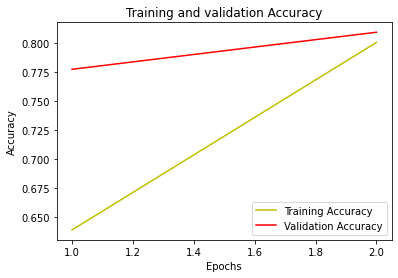
Fig 3.5. (a) a training and validation loss vs epochs plot for the FinBERT prediction model (b)a training and validation accuracy vs epochs plot for the FinBERT prediction model
Transformer layer model evaluation
below are the first 2 and last 2 training epochs for the TCNN model for price prediction:
| Epoch/50 | Loss | Val
Loss |
Acc
score |
Val
Acc |
| 1 | 1.0433 | 0.9938 | 0.4791 | 0.5396 |
| 2 | 1.0189 | 0.9877 | 0.5185 | 0.5396 |
| 49 | 0.524 | 0.8868 | 0.8004 | 0.6458 |
| 50 | 0.5128 | 0.8874 | 0.7907 | 0.6406 |
Table 3.3: metrics evaluation for the transformer layer training epochs
The following loss and accuracy plots were obtained:
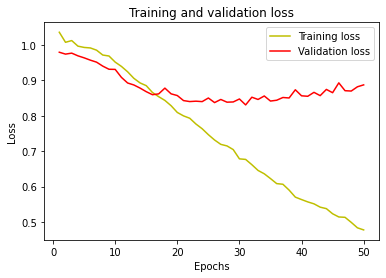
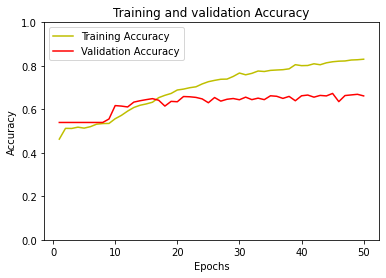
Fig 3.6. (a) a training and validation loss vs epochs plot for the transformer layer prediction model (b)a training and validation accuracy vs epochs plot for the transformer layer prediction model
Limitations of OTC Stocks Data Acquisition & Analysis with Time Series Prediction:
- Limited historical data: One limitation of using OTC stocks data for acquisition and analysis with LSTM, TCNN and BERT sentiment classification is the limited historical data available for these stocks. OTC stocks are not traded on major exchanges, so there may be less data available for analysis compared to stocks traded on the NYSE or NASDAQ.
- Lack of regulatory oversight: Another limitation is that OTC stocks are not subject to the same level of regulatory oversight as stocks traded on major exchanges. This can make it harder to accurately assess the financial health and performance of these companies, which can affect the accuracy of the data analysis.
- Lack of liquidity: OTC stocks may also have less liquidity than stocks traded on major exchanges, which can make it harder to trade them and can also affect the accuracy of the data analysis.
- Limited market sentiment data: Because OTC stocks are not traded on major exchanges, there may be less available market sentiment data for these stocks. This can make it harder to use sentiment classification techniques like BERT to analyze the overall sentiment around a particular OTC stock.
- Inability to use technical analysis: Due to lack of historical data and lower liquidity, it could be difficult to use technical analysis for predicting future prices for OTC stocks.
- Data bias: OTC stocks are mostly issued by small and mid-sized companies, which may not have the same level of coverage by analysts and the media as larger companies. This can lead to data bias and a lack of information about certain OTC stocks.
Recommendation:
Future work for this project could involve expanding the dataset to include more OTC stocks and longer time periods for analysis. This would provide a more comprehensive understanding of the trends and patterns in OTC stock performance. Additionally, incorporating additional data sources such as news articles and social media posts could improve the accuracy of the sentiment analysis by providing a broader range of information.
Another potential area of exploration is the use of reinforcement learning techniques to make predictions and generate trading strategies. This could involve training a model to learn from past data and make predictions based on current market conditions.
Finally, collaboration with financial institutions and other industry experts could be beneficial in order to validate the findings and apply the research to real-world scenarios. This could include partnerships with investment firms to test the performance of trading strategies generated by the model or working with regulators to help identify potential fraud in the OTC stock market.
Conclusion:
In conclusion, the use of OTC stocks data acquisition and analysis with LSTM, TCNN and BERT sentiment classification can provide valuable insights and predictions for investors and traders. These advanced machine learning techniques can effectively analyze and classify vast amounts of financial data, providing more accurate and reliable predictions than traditional methods. However, it is important to note that while these techniques can assist in making informed decisions, they should not be solely relied upon and should be used in conjunction with other market analysis and research. The use of advanced machine learning techniques in OTC stocks data acquisition and analysis has the potential to greatly benefit the financial industry and improve investment outcomes.
References
[1] S. Sarode, H. G. Tolani, P. Kak and C. S. Lifna, “Stock Price Prediction Using Machine Learning Techniques,” 2019 International Conference on Intelligent Sustainable Systems (ICISS), 2019, pp. 177-181, doi: 10.1109/ISS1.2019.8907958.
[2] Lv, P.; Wu, Q.; Xu, J.; Shu Y. Stock Index Prediction Based on Time Series Decomposition and Hybrid Model. Entropy 2022, 24, 146. https://doi.org/10.3390/e24020146
[3] Investopedia (2020). OTC Stocks. Retrieved from https://www.investopedia.com/terms/o/otc.asp
[4] OTC Markets Group (2020). OTCQB, OTCQX and OTC Pink. Retrieved from https://www.otcmarkets.com/investors/otcqb-otcqx-otc-pink
[5] Cooper, S. K., Groth, J. C., & Avera, W. E. (1985). Liquidity, exchange listing, and common stock performance. Journal of Economics and Business, 37(1), 19-33.
[6] Teweles, R. J., & Bradley, E. S. (1998). The stock market (Vol. 64). John Wiley & Sons.
[7] Khan, W., Ghazanfar, M. A., Azam, M. A., Karami, A., Alyoubi, K. H., & Alfakeeh, A. S. (2020). Stock market prediction using machine learning classifiers and social media, news. Journal of Ambient Intelligence and Humanized Computing, 1-24.
[8] Zhong, X., & Enke, D. (2019). Predicting the daily return direction of the stock market using hybrid machine learning algorithms. Financial Innovation, 5(1), 1-20.
[9] Arman, K. N., Teh, Y. W., & David, N. C. L. (2011). A novel FOREX prediction methodology based on fundamental data. African Journal of Business Management, 5(20), 8322-8330.
[10] Kavussanos, M. G., & Nomikos, N. K. (2003). Price discovery, causality and forecasting in the freight futures market. Review of Derivatives Research, 6(3), 203-230.
[11] Roondiwala, M., Patel, H., & Varma, S. (2017). Predicting stock prices using LSTM. International Journal of Science and Research (IJSR), 6(4), 1754-1756.
[12] Jin, Z., Yang, Y., & Liu, Y. (2020). Stock closing price prediction based on sentiment analysis and LSTM. Neural Computing and Applications, 32(13), 9713-9729.
[13] Qiu, M., Song, Y., & Akagi, F. (2016). Application of artificial neural network for the prediction of stock market returns: The case of the Japanese stock market. Chaos, Solitons & Fractals, 85, 1-7.
[14] Fenghua, W. E. N., Jihong, X. I. A. O., Zhifang, H. E., & Xu, G. O. N. G. (2014). Stock price prediction based on SSA and SVM. Procedia Computer Science, 31, 625-631.
[15]Chang, T. S. (2011). A comparative study of artificial neural networks, and decision trees for digital game content stocks price prediction. Expert systems with applications, 38(12), 14846-14851.
[16]Gidofalvi, G., & Elkan, C. (2001). Using news articles to predict stock price movements. Department of computer science and engineering, university of california, san diego, 17.
[17]Coyne, S., Madiraju, P., & Coelho, J. (2017, November). Forecasting stock prices using social media analysis. In 2017 IEEE 15th Intl Conf on Dependable, Autonomic and Secure Computing, 15th Intl Conf on Pervasive Intelligence and Computing, 3rd Intl Conf on Big Data Intelligence and Computing and Cyber Science and Technology Congress (DASC/PiCom/DataCom/CyberSciTech) (pp. 1031-1038). IEEE.
[18] Ma, Z., Bang, G., Wang, C., & Liu, X. (2020). Towards Earnings Call and Stock Price Movement. arXiv preprint arXiv:2009.01317.
[19]Kara, Y., Boyacioglu, M. A., & Baykan, Ö. K. (2011). Predicting direction of stock price index movement using artificial neural networks and support vector machines: The sample of the Istanbul Stock Exchange. Expert systems with Applications, 38(5), 5311-5319.
[20]Rezaei, H., Faaljou, H., & Mansourfar, G. (2021). Stock price prediction using deep learning and frequency decomposition. Expert Systems with Applications, 169, 114332.
[21] Shen, J., & Shafiq, M. O. (2020). Short-term stock market price trend prediction using a comprehensive deep learning system. Journal of big Data, 7(1), 1-33.
[22]Birba, D. E. (2020). A Comparative study of data splitting algorithms for machine learning model selection.
[23] Neely, C. J., & Weller, P. A. (2012). Technical analysis in the foreign exchange market. Handbook of exchange rates, 343-373.
[24] Lim, M. A. (2015). The Handbook of Technical Analysis+ Test Bank: The Practitioner’s Comprehensive Guide to Technical Analysis. John Wiley & Sons.
[25] Levy, R. A. (1966). Conceptual foundations of technical analysis. Financial Analysts Journal, 22(4), 83-89.
[26] Hu, Y., Feng, B., Zhang, X., Ngai, E. W. T., & Liu, M. (2015). Stock trading rule discovery with an evolutionary trend following model. Expert Systems with Applications, 42(1), 212-222.
[27] Waisi, M. (2020). Advantages and disadvantages of aI-based trading and investing versus traditional methods.
[28] Harries, M., & Horn, K. (1995, November). Detecting concept drift in financial time series prediction using symbolic machine learning. In AI-CONFERENCE- (pp. 91-98). World Scientific Publishing.
[29] Hagenau, M., Liebmann, M., & Neumann, D. (2013). Automated news reading: Stock price prediction based on financial news using context-capturing features. Decision Support Systems, 55(3), 685-697.
[30] Helbich, Marco, et al. “Data-driven regionalization of housing markets.” Annals of the Association of American Geographers 103.4 (2013): 871-889.
[31] Martin, D. (1977). Early warning of bank failure: A logit regression approach. Journal of banking & finance, 1(3), 249-276.
[32] Schoenecker, T., & Swanson, L. (2002). Indicators of firm technological capability: validity and performance implications. IEEE Transactions on Engineering Management, 49(1), 36-44.
[33] Kao, D. L., & Shumaker, R. D. (1999). Equity style timing (corrected). Financial Analysts Journal, 55(1), 37-48.
[34] Adam, A. M., & Tweneboah, G. (2008). Macroeconomic factors and stock market movement: Evidence from Ghana. Available at SSRN 1289842.
[35] Roy, R. P., & Roy, S. S. (2022). Commodity futures prices pass-through and monetary policy in India: Does asymmetry matter?. The Journal of Economic Asymmetries, 25, e00229.
[36] Su, K., Zhang, M., & Liu, C. (2022). Financial derivatives, analyst forecasts, and stock price synchronicity: Evidence from an emerging market. Journal of International Financial Markets, Institutions and Money, 81, 101671.
[37] Vaswani, A., Shazeer, N., Parmar, N., Uszkoreit, J., Jones, L., Gomez, A. N., … & Polosukhin, I. (2017). Attention is all you need. Advances in neural information processing systems, 30.
[38] Chava, S., Du, W., Shah, A., & Zeng, L. (2022). Measuring firm-level inflation exposure: A deep learning approach. Available at SSRN 4228332.
[39] Schumaker, R. P., & Chen, H. (2009). Textual analysis of stock market prediction using breaking financial news: The AZFin text system. ACM Transactions on Information Systems (TOIS), 27(2), 1-19.
[40] Bahdanau, D., Cho, K., & Bengio, Y. (2014). Neural machine translation by jointly learning to align and translate. arXiv preprint arXiv:1409.0473.
[41] Yang, Z., He, X., Gao, J., Deng, L., & Smola, A. (2016). Stacked attention networks for image question answering. In Proceedings of the IEEE conference on computer vision and pattern recognition (pp. 21-29).
[42] Li, Q. (2022). Attention-Based Encoder-Decoder Models for Speech Processing (Doctoral dissertation, University of Cambridge).
[43] Ma, X., Zhang, P., Zhang, S., Duan, N., Hou, Y., Zhou, M., & Song, D. (2019). A tensorized transformer for language modeling. Advances in neural information processing systems, 32.
[44] Zhang, X., Chen, Y., & He, L. (2022). Information block multi-head subspace based long short-term memory networks for sentiment analysis. Applied Intelligence, 1-19.
[45]Chen, P., Yu, H. F., Dhillon, I., & Hsieh, C. J. (2021). Drone: Data-aware low-rank compression for large nlp models. Advances in neural information processing systems, 34, 29321-29334.
[46] Wilson, C. (2013). Portable Game Based Instruction of American Sign Language.
[47] Luo, C., He, X., Zhan, J., Wang, L., Gao, W., & Dai, J. (2020). Comparison and benchmarking of ai models and frameworks on mobile devices. arXiv preprint arXiv:2005.05085.
[48] Tran, T. T., Richardson, A. J., Chen, V. M., & Lin, K. Y. (2022). Fast and accurate ophthalmic medication bottle identification using deep learning on a smartphone device. Ophthalmology Glaucoma, 5(2), 188-194.
[49] Araci, D. (2019). Finbert: Financial sentiment analysis with pre-trained language models. arXiv preprint arXiv:1908.10063.
[50]Data source https://www.otcmarkets.com/research/stock-screener
[51] Data Source; https://www.kaggle.com/datasets/sbhatti/financial-sentiment-analysis

