International Journal of Social Sciences and Scientific Studies (2022)
Listes de contenus disponibles sur: Scholar
Determinants of Employees’ Job Satisfaction; the case of Ambo University
Journal homepage: ijssass.com/index.php/ijssass
Zekariyas Adugna *BA – human resource management and Leadership
MA- Business administration-Specialized on Leadership
PhD – Chr. Leadership and Management
A/A, Ethiopia
Received 10 January 2023; Accepted 26 February 2023
Available online 1 March 2023
A R T I C L E I N F O
Keywords:
Job Satisfaction
Employees
Ambo Univerrsity
INTRODUCTION
This study basically studies about the job satisfaction of Ambo University all Campuses’ employees and recommending for the administration of the university. The purpose of this study is to help the Ambo University Organization leaders, environment of care professionals, and other institutions through showing the problem of unsatisfying of the Employee and recommending the proper school of thought of the modern management style such as employee satisfaction, initiation, and the employee’s holistic development. According to Gruenberg, 1997Job satisfaction is a comprehensive construct with a variety of definitions and related concepts, which has been studied in a variety of disciplines for many years to now. Many theories and articles of interest to managers, social psychologist, and scholars, focus on job satisfaction because most people spend their life-time for work, and understanding of the factors that increase satisfaction is important to improve the well-being of individuals in this facet of the living (Gruenberg, 1997).
.
Background of the Study
Job satisfaction is an emotional reaction to an employee’s work situation. This can be defined as an overall feeling about one’s job in terms of specific characteristics of the job (e.g., compensation, autonomy, colleagues) and it can be connected with specific results, such as productivity. Locke (1976, p.1300) defines job satisfaction as “a pleasurable or positive emotional state resulting from cognition (appraisal) of one’s job or job experience”. Similarly, Porter, Steers &Mow day, (1974) based on Smith, Kendall and Hulin (1969) work, consider “job satisfaction” as “feelings or affective responses to facets of the situation”. With government officials, satisfaction with their jobs may have strong implication for improving the quality of government services.
It is crucial for policy makers to measure the level of workers’ job satisfaction exactly in order to improve the quality of services given to citizen.
- It has been stated by public administration scholars that there is a need for an understanding of job satisfaction in public organizations (Behn 1995; Perry and Porter 1982) in order to achieve efficient outcomes towards the citizens. Job satisfaction is a difficult concept to define or study in public organizations where different issues encounter. Nevertheless, theoretical advances have been made that can assist in understanding satisfactory work context. In particular, there is a growing consensus that any model of job satisfaction should include the underlying process variables that explain how working context affect job satisfaction (Kanfer et.al., 2001).
In this line of reasoning, it is true that some employees perform better than others because they have different cognitions, competencies and performance goals (Locke and Latham 1990). According to social cognitive theories, however, it is not the competencies and the goals themselves but rather the public organizational working environment that imposes the context of how employees must perform without considering employees capabilities. The result of this process is a sense of inertia or self-dissatisfaction. Also, in public sector organizations, the experience and knowledge of an employee may not play a role as it might be placed in a job position irrelevant to its competencies.
Statement of the problem
More recently, it has been suggested that an integration of work context and employees cognitions may be particularly relevant to understanding job satisfaction in public organizations. If public sector organizations have greater procedural constrains, it may have important implications for employee work satisfaction because of their potential influence on the job characteristics and attitudes.
This study contributes to understanding of employee job satisfaction in the public sector by the results of a descriptive research, with purpose to provide insight on how the work context determines employee work satisfaction.
Using a framework presented by job characteristics and personal cognitions, this model of job satisfaction assesses whether aspects of the organizational work context, such as procedural constraints and bureaucratic structures may have an important effect on job satisfaction through the influence of employee’s cognitions.
Objective of the Study
Main objectives
The major objective of this study is to assess the extent of employees’ job satisfaction in Ambo University of all Campus {main campus, technology institute, Guder agricultural and weliso faculty of Business}.
Specific objectives
The Specific objectives of the study include: to investigate the difference in satisfaction level between academic and administrative staff; between male and female employees; to determine whether employees are satisfied with current compensation; to investigate to what extent the workers are currently satisfied with their work itself among permanent employees of Ambo University; to assess the extent to which procedural constraints have a bearing on employees’ job satisfaction; to examine whether the employees are satisfied with their colleagues; to assess whether employees are satisfied with their boss and to assess the extent to which employees have autonomy on their job.
Significance of the Study
This study ultimately serves the host university by providing the relevant information concerning the extent of workers job satisfaction. Moreover, the study serves as spring board for further researcher to conduct more intensified study. Besides it provides the readers with an important clue in understanding the issues of workers job satisfaction.
Scope of the study
The study is conducted concerning the determinants of workers’ job satisfaction. The study focuses on the subject mentioned in the host institution i.e Ambo University. The research focuses only on permanent employees of the University of both academic and administrative staff. Moreover, the study concentrates on the current period satisfaction of workersand does not include the job satisfaction that the workers experienced in the past.
Limitation of the Study
The study was somehow constrained by factors beyond the control of the researchers. These limitations include inadequate time to gather sufficient data; lack of adequate financial resource to cover the necessary materials and facilities to undertake the research; lack of willingness from the part of some respondents to fill the questionnaires. Even if those constraints were there during the conduct of the research, the researchers tried their best to mitigate them because these factors could have negative impact on the quality of the paper had they not been dealt with properly.
Delimitation of the Study
The study fully focused on the assessment of the determinants of job satisfaction of the permanent employees of Ambo University (both academic and administrative staff) at main campus. Part time and daily laborers of the university were not subject of the study. Moreover, the satisfaction level of the workers with their job in past times was not the concern of the study. Only the current period job satisfaction status was emphasized.
Organization of the Paper
This paper was organized under five chapters: The first chapter is about introduction and it consists of the background of the study; problem statement; objective of the study; scope of the study; limitation of the study and delimitation of the study. Section II is about the theoretical and empirical review of the literatures; Section III is about the methodology of the study and Section IV is the discussion analysis and interpretation and Section V is theconclusion and recommendation of the study.
II. LITERATURE REVIEW
The Overall Concept of Job Satisfaction
Job satisfaction is a comprehensive construct with a variety of definitions and related concepts, which has been studied in a variety of disciplines for many years to now. Many theories and articles of interest to managers, social psychologist, and scholars, focus on job satisfaction because most people spend their life-time for work, and understanding of the factors that increase satisfaction is important to improve the well-being of individuals in this facet of the living (Gruneberg, 1997).
The study of job satisfaction is a topic of wide interest to both people who work in organizations and people who study them. Job satisfaction has been closely related with many organizational phenomena such as motivation, performance, leadership, attitude, conflict, moral etc. Researchers have attempted to identify the various components of job satisfaction, measure the relative importance of each component of job satisfaction and examine what effects these components have on employees’ productivity.
Spector (1997) refers to job satisfaction in terms of how people feel about their jobs and different aspects of their jobs. Ellickson and Logsdon (2002) support this view by defining job satisfaction as the extent to which employees like their work. Schermerhorn (1993) defines job satisfaction as an affective or emotional response towards various aspects of an employee’s work. C.R.Reilly(1991) defines job satisfaction as the feeling that a worker has about his job or a general attitude towards work or a job and it is influenced by the perception of one’s job. J.P. Wanous and E.E. Lawler (1972) refers job satisfaction is the sum of job facet satisfaction across all facets of a job. Abraham Maslow(1954) suggested that human need from a five-level hierarchy ranging from physiological needs, safety, belongingness and love, esteem to self-actualization. Based on Maslow’s theory, job satisfaction has been approached by some researchers from the perspective of need fulfillment (Kuhlen, 1963; Worf, 1970; Conrad et al., 1985)
It is an emotional reaction to an employee’s work situation. This can be defined as an overall impression about one’s job in terms of specific aspects of the job (e.g., compensation, autonomy, colleagues) and it can be connected with specific results, such as productivity.
Factors Determining Job Satisfaction
Work environment variables
Herzberg (1959; 1966) developed two-factor theory of job satisfaction: “motivation” and “hygiene”. According to Herzberg’s theory, if handled properly, hygiene issues cannot motivate workers but can minimize dissatisfaction. Hygiene factors include company policies, supervision, salary, interpersonal relations and working conditions.
They are variables related to the worker’s environment. By contrast, a worker’s job satisfaction was influenced by factors associated with the work itself or by outcomes directly derived from it such as the nature of their jobs, achievement in the work, promotion opportunities, and chances for personal growth and recognition. Because such factors were associated with high levels of job satisfaction, Herzberg referred them as ‘motivation factors”. Hackman and Oldham (1975) proposed five “core” dimensions for evaluating the immediate work environment constituting the Job Diagnostic Survey UDS. These core dimensions turned out to be associated significantly with job satisfaction and a high sense of workers’ motivation. That is, the work environment source consisted of five dimensions, namely those of skill variety, task identity, task significance, autonomy and feedback (Reiner, & Zhao, 1999).
The most important characteristic that receives huge attention in Hackman andOldham’s study is the meaningfulness of the work that means to what extent theindividual perceives the work as significant and important. Job meaningfulness can bedefined as the product of three dimensions: skill variety (activities that challenge skillsand abilities); task identity (the extent to which the job requires completion of a“whole”, identifiable peace of work); task significance (how substantially the job hasimpacts on other people’s lives.
Job satisfaction and dissatisfaction not only depends on the nature of the job, it also depend on the expectation what’s the job supply to an employee (Hussami, 2008). Lower convenience costs, higher organizational and social and intrinsic reward will increase job satisfaction (Mulinge and Mullier, 1998; Willem et al., 2007). Job satisfaction is complex phenomenon with multi facets (Fisher and Locke, 1992; Xie and Johns, 2000); it is influenced by the factors like salary, working environment, autonomy, communication, and organizational commitment (Lane, Esser, Holte and Anne, 2010; Vidal, Valle and Aragón, 2007; Fisher and Locke, 1992; Xie and Johns, 2000).
Pay and Job Satisfaction
Heery and Noon (2001) defined pay as payment, in which include many components like basic salary, benefits, bonuses, pay for doing extra work and incentives” According to Erasmus, van Wyk and Schenk (2001) define pay, “is what an employee gets against his work after fulfilling his duty, include all type of financial and non financial rewards”. Martocchio (1998) described that compensation include both intrinsic rewards and extrinsic rewards. Extrinsic rewards include monetary and non monetary rewards. Non monetary rewards include things apart from basic pay like benefits. Money is the indicator of motivation.
Employee‟s performance will increase if they are highly paid. Money is considered as the reward which is given to employees against work, to support their family, and payment for the work which is done. Barton (2002) suggested that organization should take into account financial rewards like salary because it has strong influence on employee motivation and retention. Dessler (2008) indicated that employee pay includes all compensation factors which are given to him against his work.
Recognition and Job Satisfaction
Recognition is defined as “in organization employees are rewarded by different status, this process is called as recognition” (Danish et al., 2010). Intrinsic rewards like recognition, growth, feedback, opportunities lead employees more towards high job performance and motivation than extrinsic rewards like salary (Nel et al., 2001). Robbins (2001) described that through the recognition employee get appreciation and status like as a part of organization. Barton (2002) described that recognition is considered the most important factor among non-financial rewards in order to increase job satisfaction level of employees.
Romano (2003) pointed out that recognition is the component that is used to strengthen the relationship between organization and people. Through the recognition employee feel rewarded and motivated. By giving recognition to the employee‟s competitive advantage can be achieved. Lawler (2003) suggested that the well being of any organization depend upon how its human resource is treated. Organization achieves its well-being through giving rewards and recognition to its employees.
Promotion Opportunities and Job Satisfaction
Heery and Noon (2001) define promotion “getting high status in workplace by doing effective work, generally increase the status, position and remuneration of employee in the organization”. Grobler et al. (2002) define promotion as “going towards upward position in the organization”. Graham (1986) defines promotion as “shifting from lower designation to high designation within an organization and usually increases in pay package”. If organizations are not giving promotion to their employees then employees will be dissatisfied and their turnover rate will be high (Shields and ward, 2001). When employees get promotion they will be more committed to their organization (De Souza, 2002). Pay and promotions are considered most important element for the employee satisfaction (Parvin&Kabir, 2011).
Promotion has significant effect on employee satisfaction (Wubuli, 2009). There is positive relationship seen between job satisfaction and opportunity to develop (RAMASODI, 2010).
Meaningful Work and Job Satisfaction
Meaningful Work Is Considered More Valued Factors Than The Rewards To Employees. Now A Day Employees Want Qualitative Work And Outcomes. Employees Want Their Work To Be Meaningful Or Them. Meaningful Work Is An Emerging Factor For Valued Outcomes Of Organization (Caudron, 1997; Towers Perrin, 2003). Towers Perrin (2003) Indicated That Meaningful Work Provides Value For The Organization As Well As Value For The Employee. Meaningful Work Is An Important Issue And Valued For Both Employee And Employer. There are some other factors rather than money which any employee want to share with their community and home members. Such factors include sense of achievement and feelings of accomplishment of some task. This meaningful work is considered as a dividend to employee (Pocock, 2006). Outcomes, task characteristics and meaningful work are important for such people who have need for achievement (Hackman & Oldham, 1976). Job satisfaction cannot be separate from demand of meaningful work. It is the duty of managers to make work meaningful for their employees so that they can be satisfied with their job and due to these employees will show positive response in the organization (Ramayah et al., 2001). Meaningful work is actually the purpose of working through which they have to pass. Success, achievement and status are included in the meaningful work experiences (Pratt &Ashforth, 2003).
Different people interpret compensation differently. In this paper compensation, reward, recognition, and wages are terms used in different situations (Zobal, 1998). The compensation is defined by American Association is “cash and non-cash remuneration provided by the employer for services rendered” (ACA, p. 9). Salary was found to be the prime factor for the motivation and job satisfaction of salaried employees of the automobile industry from the results of the survey by Kathawala, Moore and Elmuti (1990). The survey tried to assess the various job characteristics and the way the employees ranked them as motivators and satisfiers. The results showed that compensation was ranked as the number one job element for job satisfaction and increase in salary for performance was ranked as the number one job element for motivation. Compensation is very valuable tool for retention and turnover. It is also a motivator for an employee in commitment with the organization which in result enhances attraction and retention (Zobal, 1998; Moncarz et al., 2009; Chiu et al., 2002). It also works as communicator when it is given to employee against his services which shows how much an employee is valuable for its organization (Zobal, 1998).
The mentoring is used for development-orientation (Scandura and Williams, 2004). When a supervisor provides mentoring, the relationship affects the protégés skill development and intentions to remain with the employer (McManus and Russell, 1997). On the other hand non-supervisory mentor may increase mentee’s confidence by providing access to outside organization (Scanduraa and Williams, 2004). The immediate supervisor support is vey important in organizational change. Although the support of supervisor is not very crucial in satisfaction but it has positive impact on satisfaction (Griffin, Patterson and West, 2001). According to Chakrabarty, Oubre, and Brown (2008) “perhaps the finest way in which supervisors can portray himself as a role model is to personally demonstrate proper techniques so that employee could understand how job should be done.” J.D. Politis (2001) has examined the roles played by leadership in the process of knowledge acquisition and a survey was carried out on 227 persons who have been engaged in knowledge acquisition activities to examine the relationship between leadership styles and knowledge acquisition attributes. The results showed that the leadership styles that involve human interaction and encourage participative decision-making are related positively to the skills essential knowledge acquisition.
According to the study conducted by Friedlander and Margulies (1969), it was discovered that management & friendly staff relationships contribute to the level of job satisfaction. However, this result contradicts with view of Herzberg (1966) who supported the view that supervision is irrelevant to the level of job satisfaction.
According to Frame (2004) work conditions are defined as an employee’s work place, work instruments, the work itself, organization policy, and organizational rules. Arnold and Feldman (1996), promoted factors such as temperature, lighting, ventilation, hygiene, noise, working hours, and resources as part of working conditions.
Framework of job satisfaction
The following diagrams show the theoretical framework indicting the bearing on the job satisfaction of employees.
Figure 1: Factors Affecting Job Characteristics
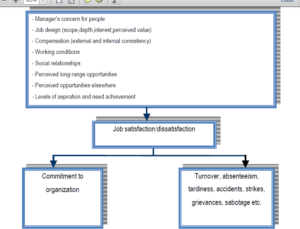
Figure 2: Determinants of Job Satisfaction and Dissatisfaction (Rue and Byaes, 2003)
III. RESEARCH DESIGN AND METHODOLOGY
Description of the Organization/Study Area
Ambo University (AU) is one of the oldest higher learning institutions in Ethiopia. The current Ambo University was established in 1939 as an agricultural school and located about 110 km West of Addis Ababa and found in the West Showa zone of the Oromia National Regional State. It has been known with different names before it assumes present naming. Among others, in 1958, the school was named as Ambo Agriculture and Forestry Secondary School; in 1967, the school was named as Ambo Institute of Agriculture; in 1974 the institute was named as Ambo Junior College of Agriculture; in the year 2003 it is affiliated to Jimma University and Named Jimma University – Ambo College; in the year 2008 Ambo University College; and in 2009 it became a full-fledged higher learning institution – Ambo University.
Presently, the university is organized into five Colleges (College of Agriculture and Veterinary Science, College of Business and Economics, College of Natural and Computational Science, College of Social Science and Humanities and College of Medicine and Health Sciences) and three Institutes (Institute of Education and Professional Study, Institute of Technology, and Institute of Cooperatives and Development Studies) which further divided into more than thirty academic departments and runs about ten graduate and more than forty undergraduate programs. Besides its main campus at Ambo, the university also has one faculty – Faculty of Business and Economics – at Woliso which, in fact, increased the number of its colleges/ institutes to nine. In addition to educational and research activities, the university conducts short term training, offers outreach services, and provides consultancy services. The University has sufficient relevant experience and expertise in the management of international and national projects.
Research Design
A descriptive research design with survey method was applied in the study. This research design helps to generate data necessary to substantiate the extent to which workers are satisfied with their job. It also enables the researchers to get representative sample from the population and to systematically explain it.
Sampling Design
Currently, there are about 974 permanent administrative and about 754 academic staff workers in Ambo University. Therefore the total population is 1728 permanent employees at Ambo University, main campus. To investigate the extent of job satisfaction among the workers, the respondents were obtained randomly to fill the questionnaire that was designed for this purpose. The sample size was determined using Yamane (1967:886) framework. This framework provides a simplified formula to calculate sample sizes. The sample size was determined as follows:
Where: n=Sample size
N= Population size
e=level of precision
n = 182 is sample size.
Here e is assumed to be 7%. Therefore the total number of questionnaire distributed was 182.
Data Sources
The researchers was used both the primary and the secondary data for the purpose of this study. Secondary data will be collected from available books, publications, research studies, articles and websites.
Data Collection Instrument
A closed-ended questionnaire is designed to collect primary data. After collecting all necessary data, data were analyzed and tabulated descriptively. And, this tabulated information used to measure perceived satisfaction and dissatisfaction level of the employees. To measure the satisfaction level a 5 point scale was used which is denoted by 1=SD (Strongly Disagree), 2=D (Disagree), 3=N (Neutral), 4=A (Agree), and 5=SA (Strongly Agree).
Methods of data analysis and interpretation
To analyze and interpret the data, simple method such as description of the frequency table, percentage and chart and graphs were used. Moreover, comparisons of the results between the administrative and academic staff; male and female and different salary level were used just to assess whether there is difference in the satisfaction level between different jobs.
IV. Data Presentation, Discussion and Analysis
Demographic Characteristics
Composition of respondents in Relation to Gender
The return rate of the distributed questionnaire was 96.2%, which means out of 182 distributed copies 175 were filled and returned. Therefore, in this study, for the discussion and analysis purpose, 175 respondents were considered.
For this study purpose, the figure about gender of the workers shows that the proportion of respondents is about 43% (75 in number) were female and about 57%(100 in number) were male respondents. This implies that sufficient number of male and female employees was obtained for the study purpose.
Table 4.1 Composition of Respondents with respect to Gender
| Gender | Frequency | Percent | Valid Percent | Cumulative Percent | |
| Valid | Female | 75 | 42.9 | 42.9 | 42.9 |
| Male | 100 | 57.1 | 57.1 | 100.0 | |
| Total | 175 | 100.0 | 100.0 | ||
Composition of respondents related to the worker type
The chart below shows that from the total of 175 respondents, the composition of administrative to academic staff is 78 in number or 45% and administrative staff is 97 in number or 55%. This indicates that proportional number of academic and administrative staff has been taken for the study purpose. Pilot test has been conducted prior to the full scale study to identify whether the employees have homogeneity. Based on this fact, the sample size for this study is 175, which is slightly more than 10% and hence the
Figure 3: Composition of Respondents with Respect to Gender
Composition of respondents in terms of holding office
The table below shows the composition of workers in terms of holding position and accordingly the major part of the respondent is office holder (nearly 67%) and non office holder is nearly (33%)
Table 4.2: Composition of Respondents by Office
| Office Holder? | Frequency | Percent | Valid Percent | Cumulative Percent | |
| Valid | Office Holder | 117 | 66.9 | 66.9 | 66.9 |
| Non office Holder | 58 | 33.1 | 33.1 | 100.0 | |
| Total | 175 | 100.0 | 100.0 | ||
Composition of Respondents by amount of salary they earn
The table below shows that majority of the respondents (45%) earn monthly salary of Birr 1000-2000 and only 1% earn more than 5000 Birr. On cumulative basis, about 77% of the respondent earn monthly salary of up to Birr 4000. Therefore, one can say that the enormous proportion of the respondents is those having monthly salary of 4000 Birr or less.
Table 4.3: Composition of Respondents by Salary Level
| Salary Level | Frequency | Percent | Valid Percent | Cumulative Percent | |
| Valid | Up 1000 Birr | 27 | 15.4 | 15.4 | 15.4 |
| 1000-2000 Birr | 79 | 45.1 | 45.1 | 60.6 | |
| 2000-3000 Birr | 19 | 10.9 | 10.9 | 71.4 | |
| 3000-4000 Birr | 10 | 5.7 | 5.7 | 77.1 | |
| 4000-5000 Birr | 38 | 21.7 | 21.7 | 98.9 | |
| More than 5000 Birr | 2 | 1.1 | 1.1 | 100.0 | |
| Total | 175 | 100.0 | 100.0 | ||
Composition of Respondents by work experience
The respondents are having wide range of work experience in the university. The minimum experience category was up to three years and the maximum category is more than 15 years. Accordingly, the major proportion of respondents ha sup three years of work experience (nearly 42%) at the university and on cumulative basis, about 81% have up to seven years of work experience.
Composition of Respondents by access to on job training
In this part of the study, the composition of respondents who have got the chance of on job training are nearly the same as those who did not get training. Therefore we can say that access to on job training is only to the extent of half. This means only 50% of the respondents had training opportunity.
Figure 4: Composition of Respondents with Respect to Access to Training
Response distribution on role clarity, support of boss and relationship with coworkers
The majority of the respondent (88%) believes that their role in the job assigned to them is clear. Moreover, the major proportion of the respondents (nearly 83%) believes that the boss is supportive. When we see the nature of the relationship with the coworkers, about 63.4% of the respondents believe that there is high level of agreeableness among coworkers. In general these factors will have positive contribution towards employees’ job satisfaction in Ambo University.
Table 4.5: response distribution on Role clarity, Support of Boss and Relationship with Coworkers
| Frequency | Percent | Valid Percent | Cumulative Percent | ||
| Clear Role? | No | 20 | 11.5 | 11.5 | 11.5 |
| Yes | 154 | 88.0 | 88.0 | 99.5 | |
| Supportive boss? | No | 30 | 17.1 | 17.1 | 17.1 |
| Yes | 145 | 82.9 | 82.9 | 100.0 | |
| Agreeable coworkers | Low | 6 | 3.5 | 3.5 | 3.5 |
| Medium | 58 | 33.1 | 33.1 | 36.6 | |
| High | 111 | 63.4 | 63.4 | 100.0 | |
| Total | 175 | 100.0 | 100.0 | ||
Job Satisfaction Assessment between Academic and Administrative staff
In this section, employees’ job satisfaction has been analyzed in terms of the following sub classes:
These are, the job itself, compensation, coworker and boss, transparency and work procedures, performance appraisal and promotion; recognition and impartiality and work achievement and personal work life
Satisfaction with the job component between academic and administrative staff
The job component has been identified as follows and includes clarity of the job; physical environment of the job; location of the job; work responsibility; comfort of the work; variety of the tasks and job security. In this section the responses of respondents were taken from by developing positive statement for all items and maximum value of each response is 5 and the minimum value is 1. Therefore, to convert satisfaction level to percentage, the number is divided by 5 and multiplied by 100%. Accordingly, academic and administrative staffs’ response rating has been separately taken and summarized as follows:
Figure 5: Academic and Administrative Staffs satisfaction Distribution With the job itself
Fig 4.1 shows that academic and administrative employees have almost the same level of satisfaction with the comfort of their job responsibilities (67%) and with variety of their tasks (about70%). On the other hand, the administrative staffs are more satisfied than academic staff with respect to physical environment of the university (82.2%) compared to satisfaction level of academic staffs which is 63.2%; location of the university (83.8% compared to satisfaction level of academic staffs which is 69.8% and the overall job security (71.8% compared to satisfaction level of academic staffs which is 59.6%. However, the academic staff is more satisfied than the administrative staff with respect to clarity of the job they are assigned to which 78.4% is compared to satisfaction level of administrative staffs which is 73.4%.
In general, when we refer to factors mentioned in the figure 4.1, as aggregate, the administrative workers are more satisfied compared to academic staff in most of the parameters of job component.
Compensation
This section comprises the assessment of satisfaction level of employees in relation to compensation and includes salary structure, compensation and long term fringe benefits that the university currently offers.
Figure 6: Academic and Administrative Staff Satisfaction Distribution with Compensation
Fig 4.4: Academic and administrative staff satisfaction level with respect to compensation
Fig 4.4 shows that the compensation is the source of dissatisfaction for employees of Ambo University on relativity basis, because the mean score of the response of employees is lowest compared to other dimension of the job. In all the parameters, the satisfaction level of employees is similarly low for both academic and administrative staffs. However, the satisfaction level of compensation other than salary is slightly higher compared to that of salary level.And academic staffs are more satisfied slightly compared to the administrative staffs.
Relationship with coworkers and boss
This section shows the extent of satisfaction of male and female workers with respect to workers relationship with coworkers and boss.
Table 4.6: Gender Perspective Satisfaction with respect to Interpersonal Relationship
| Staff | ||
| Coworkers/Boss relationship Parameters | Academic
Mean score (min 1 and maximum 5) |
Administrative Mean score
(min 1 and maximum 5) |
| I am satisfied with work relationship with coworkers | 3.82 | 4.03 |
| I am satisfied with bosses in my workplace as positive role models | 2.84 | 2.88 |
| Grand mean | 3.33 | 3.46 |
The table 4.6 shows that the satisfaction level of both academic and administrative staff is relatively higher with coworkers compared to satisfaction level with boss. On the other hand, administrative staffs have slightly more satisfaction with coworkers and boss compared to academic staffs.
Transparency and Work Procedures
In this part, the satisfaction level of workers with vested right to forward opinion; leave policy; work procedures and transparency and participatory decision making procedures of the university.
Table 4.7: Distribution of Satisfaction level with Transparency and work Procedures
| Staff | ||
| Transparency and work procedures Parameters | Academic
Mean score (min 1 and maximum 5) |
Administrative
Mean score (min 1 and maximum 5) |
| I am satisfied with the given right to put forward my opinions | 2.65 | 2.81 |
| I am satisfied with leave policy of the company | 3.08 | 3.04 |
| I am satisfied with work procedures of the university | 2.06 | 2.57 |
| I am satisfied with the existing transparent and participatory decision making procedures | 2.43 | 2.41 |
| Grand mean | 2.56 | 2.71 |
The satisfaction level of employees with transparency and work procedures is nearly moderate, which is 51.2% and 54.2% respectively for academic and administrative employees. In this section, the satisfaction level with leave policy is consistently higher for both academic and administrative workers. Academic staff are least satisfied with the work procedures (41.2%). Administrative staffs are least satisfied (48.2%) with transparency and participatory decision making.
Performance appraisal and promotion
This part of the analysis indicates the extent of satisfaction of employees vis a-vis performance appraisal policy and meritocracy based promotion issues.
Table 4.8: Satisfaction Level with Performance Appraisal and Promotion
| Staff | ||
| Performance appraisal and promotion | Academic
Mean score (min 1 and maximum 5) |
Administrative
Mean score (min 1 and maximum 5) |
| I am satisfied with the present performance appraisal policy of the university | 2.33 | 2.87 |
| I am satisfied with meritocracy based promotion | 3.12 | 2.27 |
| Grand mean | 2.72 | 2.57 |
The satisfaction level of employees with performance appraisal and promotion issues is somehow moderate, i.e., 54.4% for academic staff and 51.4% for administrative staff on average for both performance appraisal and merit based promotion parameters. Concerning merit based promotion, the satisfaction level for academic staff is more (62.4%) compared to that of administrative staff (45.4%). This implies that there is large gap between academic and administrative staff concerning satisfaction with meritocracy based promotion. The satisfaction level for administrative staff in performance appraisal policy is more (57.4%) compared to that of the academic staff (46.6%).
Recognition and impartiality
In this section, the extent of satisfaction from the perspective of recognition and impartiality has been presented. The workers have rated the satisfaction level related to recognition and impartiality of the university. This section has sub components that explain it and includes giving recognition of outstanding works; the right set of duties provided and the extent of with impartiality.
Table 4.9: Satisfaction Level with Respect to recognition and Impartiality
| Staff | ||
| Academic
Mean score (min 1 and maximum 5) |
Administrative
Mean score (min 1 and maximum 5) |
|
| I am happy with the recognition and rewards for my outstanding works and contributions | 2.45 | 2.54 |
| I am satisfied as I have been awarded the right set of duties as per my ability | 2.98 | 3.17 |
| I am satisfied with the impartiality of the university | 2.31 | 2.28 |
| Grand mean | 2.58 | 2.66 |
The table presents that on average the satisfaction level of both academic (46.2%) and administrative (45.6%) workers are nearly the same in the recognition and impartiality of the university. The satisfaction level of the workers related to impartiality of the university is least compared to others. From this category, the workers are more satisfied relatively with the set of duties they are assigned to as per the workers ability.
Work achievement and personal life
Work achievement and personal life are explained by certain factors. These factors are identifies for this study as maintaining healthy balance between work and family life and feeling of satisfaction and personal achievement with responsibility.
The table below shows that academic staffs are relatively more satisfied with achievement and personal life consistently compare to administrative staffs. On average, the satisfaction level is 71.6% for academic staffs and 69.6% for administrative staffs. This shows that there is consistency in satisfaction level between academic and administrative staffs.
Table 4.10: Satisfaction level with work achievement and Personal Life
|
Work achievement and personal life |
Staff | |
| Academic
Mean score (min 1 and maximum 5) |
Administrative
Mean score (min 1 and maximum 5) |
|
| I am satisfied and able to maintain healthy balance between work and family life | 3.45 | 3.31 |
| Fulfilling my responsibilities gives me the feeling of satisfaction and personal achievement | 3.71 | 3.66 |
| Grand mean | 3.58 | 3.48 |
Job satisfaction level of male and female workers
In this section, employees’ job satisfaction has been analyzed in terms of the following sub classes:
These are, the job itself, compensation, coworker and boss, transparency and work procedures, performance appraisal and promotion; recognition and impartiality and work achievement and personal work life
Satisfaction with the work component between male and female workers
The work component has been identified as follows and includes clarity of the job; physical environment of the job; location of the job; work responsibility; comfort of the work; variety of the tasks and job security. Accordingly, male and female response rating has been separately taken and summarized as follows:
Table 4.11: Gender based Satisfaction Level with Respect to The job itself
| Gender | ||
| Parameters: Job related | Male
Mean score |
Female
Mean score |
| The job I am assigned is clear | 3.75 | 3.72 |
| Physical environment of the job satisfied me | 3.85 | 3.84 |
| Location of the job/ institution satisfied me | 3.97 | 4.03 |
| Work responsibility makes me satisfied | 3.40 | 3.53 |
| I feel comfortable with my responsibilities | 3.23 | 3.51 |
| I am satisfied with various activities in the university and love participating in them | 3.60 | 3.48 |
| I am happy with overall job security | 3.31 | 3.56 |
| Grand mean score | 3.59 | 3.67 |
Source: Questionnaire result compilation
Table 4.11 show that male and female employees have almost the same level of satisfaction with the physical environment of the university, which is nearly 3.85, when converted to percentage is 75%. The workers have relatively highest level of satisfaction with location of the university/job, as compared to other factors and slightly the female workers are more satisfied with the location of the institution. This implies that the university has advantage to attract its employees from the point of view of its location. Female workers are more satisfied with their responsibility compared to the male counterpart. Females again have relatively better satisfaction level with job security compared to male counterpart which about 71.2% and 66.2% respectively for female and male employees.
In general, when we refer to factors mentioned in the table, the workers are almost comparable satisfaction level except in the job security and variety of tasks. The overall satisfaction level of the employees with respect to the job component for male and female employees is 71.8% and 73.4% respectively for male and female employees. From this, it could be understood that relatively, female workers are more satisfied than the male workers.
Compensation
This section comprises the assessment of satisfaction level of employees in relation to compensation and includes salary structure, compensation and long term fringe benefits that the university currently offers.
Table 4.12: Gender perspective satisfaction Level with Respect to Compensation
|
||||||||||||||||||
Source: computation of the questionnaire result
Table 4.2 shows that the compensation is the source of dissatisfaction for employees of Ambo University on relativity basis. Even though the satisfaction level with respect to compensation, in all of the three parameters shown above, female employees are more satisfied compared to the male counterpart. On average the extent of satisfaction with respect to compensation is 42% and 44.4% for male and female workers respectively.
Relationship with people
This section shows the extent of satisfaction of male and female workers with respect to workers relationship with coworkers and boss.
Table4. 13: Gender Perspective Satisfaction Level with Respect to Interpersonal Relationship
| Gender | ||
| Coworkers/Boss relationship Parameters | Male
Mean |
Female
Mean |
| I am satisfied with work relationship with coworkers | 3.88 | 4.09 |
| I am satisfied with bosses in my workplace as positive role models | 2.58 | 3.25 |
| Grand mean | 3.23 | 3.67 |
The table 4.13 shows that relatively female employees are more satisfied with their coworkers and boss. On the other hand male employees have lower level of satisfaction with this category and particularly they are not satisfied with their boss (51.6%). Again both male and female employees are more satisfied with coworkers than that of the boss. On average, male are satisfied with people to the extent of 64.6% compared to that of the female counterpart, which is 73.4%.
Transparency and work procedures
In this part, the satisfaction level of workers with vested right to forward opinion; leave policy; work procedures and transparency and participatory decision making procedures of the university.
Table 4.14: Gender Perspective Satisfaction Distribution With Respect to Transparency and Work Procedures
| Gender | ||
| Transparency and work procedures Parameters | Male Mean | Female Mean |
| I am satisfied with the given right to put forward my opinion s | 2.74 | 2.80 |
| I am satisfied with leave policy of the company | 3.11 | 2.97 |
| I am satisfied with work procedures of the university | 2.28 | 2.63 |
| I am satisfied with the existing transparent and participatory decision making procedures | 2.35 | 2.51 |
| Grand mean | 2.62 | 2.73 |
The satisfaction level of employees with transparency and work procedures is nearly moderate, which is 52.4% and 54.6% respectively for male and female employees. Even in this parameter, female employees have better satisfaction level compared to female counterpart. In this section, the satisfaction level with leave policy is consistently higher for both male and female employees. Female are least satisfied (50.2%) with transparency and participatory decision making and male workers are least satisfied (45.6%) with work procedures of the university.
Performance Appraisal and Promotion
This part of the analysis indicates the extent of satisfaction of employees vis a-vis performance appraisal policy and meritocracy based promotion issues.
Table 4.15: Gender Perspective Satisfaction Level with respect to Performance Appraisal and Promotion
| Gender | ||
| Performance appraisal and promotion | Male Mean | Female Mean |
| I am satisfied with the present performance appraisal policy of the university | 2.74 | 2.80 |
| I am satisfied with meritocracy based promotion | 3.11 | 2.97 |
| Grand mean | 2.93 | 2.89 |
On average, the satisfaction level of employees with performance appraisal and promotion issues in moderate category. Particularly, this means the satisfaction level of both male and female employees is 58.6% and 57.8%. This also shows that the satisfaction of male and female workers is consistently low and very much closer to one another.
Recognition and Impartiality
In this section, the extent of satisfaction from the perspective of recognition and impartiality has been presented. This has sub components that explain it includes giving recognition of outstanding works; the right set of duties provided and the extent of satisfaction with impartiality.
Table 4.16: Gender Perspective Satisfaction Level with respect to Recognition and Impartiality
| Gender | ||
| Male Mean | Female Mean | |
| I am happy with the recognition and rewards for my outstanding works and contributions | 2.50 | 2.53 |
| I am satisfied as I have been awarded the right set of duties as per my ability | 3.24 | 2.95 |
| I am satisfied with the impartiality of the university | 2.27 | 2.31 |
| Grand mean | 2.67 | 2.60 |
The table presents that on average the satisfaction level of both male and female workers is nearly the same concerning the recognition and impartiality of the university. When we evaluate the extent of satisfaction, it is moderate, which is 53.4% for male and 52% for female workers. From this category, the workers are more satisfied relatively in terms of the fact that they have been awarded the right set of duties as per the workers ability.
Work Achievement and Personal Life
These factors are identifies for this study as maintaining healthy balance between work and family life and feeling of satisfaction and personal achievement with responsibility.
The table below shows that male employees are relatively more satisfied with achievement and personal life consistently compared to female employees. On average, the satisfaction level is 72.5% for male employees and 67.2% for female employees. This shows satisfaction level of male employees is slightly more than the satisfaction level of female employees. The male employees are more (76%) satisfied with fulfilling personal achievement compared to that of the female counterpart(70.2%).
Table 4.17: Gender Perspective Satisfaction Level with Respect to Achievement and Personal Life
|
Work achievement and personal life |
Gender | |
| Male Mean | Female Mean | |
| I am satisfied and able to maintain healthy balance between work and family life | 3.45 | 3.21 |
| Fulfilling my responsibilities gives me the feeling of satisfaction and personal achievement | 3.80 | 3.51 |
| Grand mean | 3.625 | 3.36 |
Job satisfaction and Salary Level
The workers’ satisfaction in relation of the work itself is the result of seven proxies as follows. The job itself includes clarity of the job; physical environment of the job; location of the job; job responsibility; variety of tasks and job security.
Distribution of Satisfaction level with the job itself and salary level
Fig 4.5 Job satisfaction level with the work itself vs. salary level
Satisfaction level with the job itself is not so widely dispersed. However, those earning monthly salary of 1000-2000 Birr are slightly more satisfied than the workers in other salary category. The overall satisfaction level of workers with the job itself is about 70%. Those employees earning salary of up to 1000 Birr and 1000-2000 Birr have more average satisfaction level compared to other salary category. On the other hand, those earning salary level of 3000-4000 Birr and 4000-5000 Birr have relatively lower level of job satisfaction. This implies that those earning low level of monthly salary have better satisfaction with their job and those earning relatively higher salary level have lower satisfaction level with their job.
Salary Level of Employees vis –a-vis Satisfaction with Compensation
Table 4.18: Distribution of Satisfaction Level with Salary Level
|
Compensation parameters/Factors |
Salary level | ||||
| Up to 1000 Birr | 1000-2000 Birr | 2000-3000 Birr | 3000-4000 Birr | 4000-5000 Birr | |
| I am satisfied with existing salary Structure | 1.44 | 1.99 | 2.53 | 2.60 | 2.16 |
| I am satisfied with the compensations I get | 2.33 | 2.24 | 2.21 | 2.20 | 2.58 |
| I am satisfied with long range fringe benefits of the university | 2.52 | 2.58 | 2.53 | 2.30 | 2.03 |
| Grand Mean score | 2.10 | 2.27 | 2.42 | 2.37 | 2.25 |
Table above shows that satisfaction level of employees across different salary level. Accordingly, those employees earning lowest salary category are least satisfied with their salary level (28.8%). On the other hand, those earning monthly salary levels of Birr 3000-4000 are relatively most satisfied with their salary level (52%) compared to other salary category. Those earning the highest category of monthly salary are relatively least satisfied (40.6%) with fringe benefits compared to other workers in other salary category. On average, those earning intermediate level of salary are relatively most satisfied (48.4%) with the existing compensation compared to other salary category workers. In general satisfaction level of employees with compensation is least compared to other determinant factors of job satisfaction.
Salary Level of Employees vis –a-vis Satisfaction with Coworkers & Boss
Table 4.19: Distribution of Satisfaction Level with Coworkers and Boss
| Coworkers/Boss relationship Parameters | Up to 1000 Birr | 1000-2000 Birr | 2000-3000 Birr | 3000-4000 Birr | 4000-5000 Birr | More than 5000 Birr |
| I am satisfied with work relationship with coworkers | 3.93 | 4.16 | 3.63 | 4.10 | 3.76 | 3.50 |
| I am satisfied with bosses in my workplace | 2.63 | 3.08 | 2.42 | 2.20 | 3.00 | |
| Grand mean | 3.28 | 3.62 | 3.03 | 3.15 | 3.38 | 3.50 |
Employees earning low monthly salary category (1000-2000 Birr) are most satisfied with their coworkers (83.2%) and bosses (61.6%) compared to workers in other salary category. However, as you can see in the table, the workers are more satisfied with their coworkers than their boss. Moreover, all salary category employees are most satisfied with their coworkers compared to their bosses. On the other hand, employees earning the highest salary category are least satisfied (70%) with their coworkers compared to other salary category workers. In general employees earning low monthly salary are most satisfied compared to other employees with respect to coworkers and boss relationship.
Salary Level of Employees vis –a-vis Satisfaction with Transparency and work procedures
Table 4.20: Distribution of Satisfaction Level with Transparency and Work Procedures
| Transparency and work procedures Parameters | Up to 10000 Birr | 1000-2000
Birr |
2000-3000 Birr | 3000-4000 Birr | 4000-5000 Birr | More than 5000 Birr | |
| I am satisfied with the given right to put forward my opinions |
2.74 |
2.90 | 3.05 | 2.20 | 2.50 | ||
| I am satisfied with leave policy of the company | 2.59 | 2.65 | 2.53 | 2.60 | 2.16 | ||
| I am satisfied with work procedures of the university |
2.04 |
2.38 | 2.26 | 2.40 | 2.18 | 3.50 | |
| I am satisfied with the existing transparent and participatory decision making procedures | 2.52 | 2.47 | 2.16 | 2.40 | 2.37 | 2.50 | |
| Grand mean | 2.47 | 2.60 | 2.50 | 2.40 | 2.30 | ||
Table above shows that workers in different category of salary level are moderately satisfied with the right to forward their opinion. Employees with the highest salary level are most satisfied (70%) with work procedures of the university compared to employees earning the other categories of salary. With this regard, relatively, the employees with lowest salary level are most satisfied compared to highest salary category. In general, those which low to medium salary are more satisfied with Transparency and work procedures.
Salary Level of Employees vis –a-vis Existing Performance appraisal and promotion
Table 4.20: Performance Appraisal and Employees satisfaction level across different salary category
| Performance appraisal and promotion | Up to 10000 Birr | 1000-2000
Birr |
2000-3000 Birr | 3000-4000 Birr | 4000-5000 Birr | More than 5000 Birr | ||
| I am satisfied with the present performance appraisal policy of the university | 2.44 | 3.09 | 2.63 | 2.30 | 2.29 | |||
| I am satisfied with meritocracy based promotion | 2.52 | 2.47 | 2.16 | 2.40 | 2.37 | 2.50 | ||
| Grand mean | 2.48 | 2.78 | 2.395 | 2.35 | 2.33 | 2.50 | ||
The table above shows that the satisfaction level of employees is more or less low. Particularly, the employees with the highest salary level are least satisfied on average. Employees earning monthly salary of 1000-2000 birr are relatively most satisfied group. However, when it is evaluated on the overall basis, the satisfaction level of employees with performance appraisal and merit based promotion is low, which is less than 50%.
Salary Level of Employees vis –a-vis satisfaction with Recognition and Impartiality
Table 4.21. Distribution of satisfaction level of satisfaction for different salary category with Recognition and Impartiality
| Recognition and Impartiality | Up to 10000 Birr | 1000-2000
Birr |
2000-3000 Birr | 3000-4000 Birr | 4000-5000 Birr | More than 5000 Birr | ||
| I am happy with the recognition and rewards for my outstanding works and contributions | 2.41 | 2.72 | 2.53 | 2.10 | 2.26 | 2.50 | ||
| I am satisfied as I have been awarded the right set of duties as per my ability | 3.37 | 3.24 | 3.05 | 2.20 | 2.89 | 2.50 | ||
| I am satisfied with the impartiality of the university | 2.33 | 2.24 | 2.68 | 2.50 | 3.08 | |||
| Grand Mean | 2.70 | 2.73 | 2.75 | 2.27 | 2.74 | 2.50 | ||
On relativity basis, employees earning the lowest monthly salary are most satisfied because they believe that they have been awarded the right set of duties as per their ability. On the other hand, those earning the highest monthly salary are least satisfied. Conversely, they are relatively most satisfied with the impartiality of the university. On aggregate, the satisfaction level of employees was very similar irrespective of the salary category they were in. In fact, the satisfaction level is moderate which is about 52%
Salary Level of Employees vis –a-vis Work Achievement and Personal Life
Table 4.22. Distribution of satisfaction level of satisfaction for different salary category with Work Achievement and Personal Life
| Work Achievement and Personal Life | Up to 10000 Birr | 1000-2000
Birr |
2000-3000 Birr | 3000-4000 Birr | 4000-5000 Birr | More than 5000 Birr | ||
| I am satisfied and able to maintain healthy balance between work and family life | 2.63 | 3.66 | 3.11 | 2.60 | 3.55 | |||
| Fulfilling my responsibilities gives me the feeling of satisfaction and personal achievement | 2.67 | 3.18 | 2.79 | 2.80 | 3.26 | 3.00 | ||
| Grand mean | 2.65 | 3.42 | 2.95 | 2.7 | 3.41 | 3.00 | ||
The table above shows that employees with lowest category of monthly salary were least satisfied (53%) their work achievement and personal life on aggregate basis. On the other hand, employees earning the higher salary level (Birr 4000-5000) are most satisfied. Moreover, employees earning monthly salary of Birr 1000-2000 are most satisfied equally as the higher salary category. This implies that the satisfaction level of employees with their work achievement and personal life is not dependent on the salary level of the employees as satisfaction level with this respect is high or low irrespective of their salary level.
IV. CONCLUSION AND RECOMMENDATIONS
Conclusions
Administrative workers are more satisfied compared to academic staff with their work content.
The compensation is the source of dissatisfaction for employees of Ambo University on relativity basis. In all the parameters, the satisfaction level of employees is similarly low for both academic and administrative staffs. The satisfaction level of compensation other than salary is slightly higher compared to that of salary level. And academic staffs are more satisfied slightly compared to the administrative staffs with non salary compensation.
The satisfaction level of both academic and administrative staff is relatively higher with coworkers compared to satisfaction level with boss. On the other hand, administrative staffs have slightly more satisfied with coworkers and boss compared to academic staffs.
Academic staffs are least satisfied with the simplicity of work procedures compared to that of administrative staffs. Administrative staffs are least satisfied with transparency and participatory decision making. At aggregate level, employees are moderately satisfied with transparency and work procedures of the university, which is about 51% and 54% respectively for academic and administrative staffs.
Concerning merit based promotion; the satisfaction level for academic staff is more compared to that of administrative staff. The satisfaction level of employees with performance appraisal and promotion issues is somehow moderate for both academic staffs, which is about 53% on average.
The satisfaction level of the workers with impartiality of the university is least compared to other component of job satisfaction parameters, which is about 46.2% for academic and 45.6% for administrative staffs. The workers are more satisfied relatively with the set of duties they are assigned to as per the workers ability.
Academic staffs are relatively more satisfied with achievement and personal life consistently compared to administrative staffs.
The workers have relatively highest level of satisfaction with location of the university/job, as compared to other factors and slightly the female workers are more satisfied with the location of the University. This implies that the University has advantage to attract its employees from the point of view of its location. Female workers are more satisfied with their job responsibility compared to the male counterpart. Moreover, females are relatively more satisfied than the male workers with respect to the work itself.
On average the extent of satisfaction with respect to compensation is 42% and 44.4% for male and female workers respectively. This shows that even if the satisfaction level with respect to compensation is lowest compared to other components, relatively female workers are more satisfied compared to the male counterparts.
Both male and female employees are more satisfied with coworkers than that of the boss. In general, female workers are more satisfied with male counterparts. The satisfaction level with leave policy is consistently higher for both male and female employees.
The satisfaction level of employees with performance appraisal and promotion issues is in moderate category. Particularly, this means the satisfaction level of both male and female employees is 58.6% and 57.8% respectively. This also shows that the satisfaction of male and female workers is consistently low and very much closer to one another.
Male employees are relatively more satisfied with achievement and personal life consistently compared to female employees.
Those employees earning salary level of moderate to high level have relatively lower level of job satisfaction. This implies that those earning low level of monthly salary have better satisfaction with their job compared to those earning relatively higher salary.
Those employees earning lowest salary category are least satisfied with their salary level compared to other salary category workers. On the other hand, those earning moderate monthly salary were relatively most satisfied with their salary level compared to employees in other salary categories. On the other hand, those earning the highest category of monthly salary were relatively least satisfied with fringe benefits compared to other workers in other salary categories.
Employees earning low monthly salary category (1000-2000 Birr) were most satisfied with their coworkers (83.2%) and bosses (61.6%) compared to workers in other salary categories. This implies that the fact that you earn lower salary does not necessarily adversely affect your satisfaction with your coworkers. However, comparatively, workers in all salary categories were consistently more satisfied with their coworkers than their boss in general. On the other hand, employees earning the highest salary category are least satisfied (70%) with their coworkers compared to other salary category workers.
Workers in different category of salary level are moderately satisfied with the right to forward their opinion. Employees with the highest salary level are most satisfied (70%) with work procedures of the university compared to employees earning the other categories of salary. With this regard, relatively, the employees with lowest salary level are most satisfied compared to highest salary category. In general, those with low to medium salary are more satisfied with Transparency and work procedures.
However, when it is evaluated on the overall basis, the satisfaction level of employees with performance appraisal and merit based promotion is low, which is less than 50% on average.
On relativity basis, employees earning the lowest monthly salary are most satisfied with the fact that they were given the right set of duties as per their ability. On the other hand, those earning the highest monthly salary were least satisfied with the same. Conversely, those earning highest salary categorywere relatively most satisfied with the impartiality of the university. On aggregate, the satisfaction level of employees was very similar irrespective of the salary category they were in. In fact, the satisfaction level is moderate which is about 52%.
Employees with lowest category of monthly salary were least satisfied (53%) with their work achievement and personal life on aggregate basis. On the other hand, employees earning the higher salary level were most satisfied with the same. Moreover, employees earning lower monthly salary (or Birr 1000-2000)were most satisfied equally as the higher salary category employees with their work achievement. This implies that the satisfaction level of employees with their work achievement and personal life is not dependent on the salary level of the employees as satisfaction level with this respect is high or low irrespective of their salary level.
Recommendations
The result of the study indicated that academic staffs were more satisfied compared to administrative staff with clarity of their work. Therefore, in order for their job to be more satisfying for administrative staff, the job should be clearly articulated, the job content should be specified and matched with employees’ ability.
Ambo University should try to provide compensation other than salary based on the relative performance of the employees just to reduce their dissatisfaction level.
The fact that satisfaction level of both academic and administrative staff is relatively higher with coworkers is encouraging. However, the satisfaction level with boss is low which necessitates the superiors to establish strong interpersonal relations with their subordinates. Even the interpersonal relationship among the workers should be enhanced so as to improve satisfaction that the workers have with their coworkers.
Administrative staffs are least satisfied with transparency and participatory decision making. Therefore, to enhance the satisfaction of employees, the University should be transparent enough and decision which concerns the employees should be made by involving them.
Satisfaction level for academic staff is more compared to that of administrative staff concerning merit based promotion which is (62.4%) compared to that of administrative staff (45.4%).This is very low even for academic staff and it needs to be enhanced by strictly adhering to meritocracy. Especially concerning the administrative employees, much should be done to improve their satisfaction. Moreover, the satisfaction level with performance appraisal system should be worked out by making clear the standards of performance, the goals and how to measure performance. With this regard, especially administrative workers should be given utmost attention.
The satisfaction level of the workers with impartiality of the university is least compared to other job satisfaction parameters, which is about 46.2% for academic and 45.6% for administrative staffs. Therefore, this is a remarkable signal for the University to significantly work on treating every employee equally. The fact that the workers are more satisfied relatively with the set of duties they are assigned to as per the workers ability is a very good value. Therefore it should be kept up.
The workers have relatively highest level of satisfaction with location of the university/job, as compared to other factors and slightly the female workers are more satisfied with the location of the University. This implies that the University should make use of this advantage to attract its employees from the point of view of its location. Female workers are more satisfied with their job responsibility compared to the male counterpart. Moreover, females are relatively more satisfied than the male workers with respect to the work itself. This should be closely monitored and even improved for better sustainability.
The satisfaction level with compensation is very low for both male and female employees. Therefore, the university should particularly pay attention to the fact that employees should be given especially non salary compensation taking in to account the role they are playing.
Male employees are relatively more satisfied with achievement and personal life consistently compared to female employees. Therefore, female employees should be encouraged in order to achieve better result so as to ultimately be more satisfied.
The fact that you earn lower salary does not necessarily adversely affect your satisfaction with your coworkers. Therefore the University should try to enhance the interpersonal relationship among employees by engaging them in teamwork activities; recognizing the teams and encouraging them to achieve better performance. This should work for employees earning the highest salary category who are currently least satisfied with their coworkers.
However, when it is evaluated on the overall basis, the satisfaction level of employees with performance appraisal and merit based promotion is low, which is less than 50% on average. From this the University should take a big lesson and try to make performance appraisal and the merit based promotion as transparent as possible.
On relativity basis, employees earning the lowest monthly salary are most satisfied with the fact that they were given the right set of duties as per their ability. On the other hand, those earning the highest monthly salary were least satisfied with the same. In general, the university should let every member of the organization be assigned to tasks by considering the workers ability, educational background and as per the description and specification of the job.
REFERENCES
A.H. Maslow (1954) Motivation and Personality. New York: Harper & Row.
AL-Hussami M (2008). A Study of nurses’ job satisfaction: The relationship to organizational commitment, perceived organizational support, transactional leadership, transformational leadership, and level of education. Eur. J. Sci. Res., 22(2): 286-295. Arnold and Feldman (1996),
Spector, P. E. (2000). Industrial & organizational psychology (2nd ed.). New York: John Wiley & Sons.
C.R.Reilly(1991) Organizational Behavior. Annual Review of Psychology, pp. 427- 458 Chakrabarty, Oubre, and Brown (2008),.
E. A Locke (1980)The Nature and Causes of Job Satisfaction. M.D Dunnette (Ed.), Handbook of Industrial and Organizational Psychology, Chicago, Rand McNally. pp.1297-1349
Ellickson.M.C.,& Logsdon, K. (2002).Determinants of job satisfaction of municipal government employees [Electronic version]. Public Personnel Management, 31(3), 343-358.
F. Herzberg (1966) Work and the Nature of Man. Staple Press. London.Frame (2004) work conditions Friedlander and Margulies (1969), ”.
Hackman and Oldham (1975
Herzberg F, Mausner B, Snyderman BB (1959). The motivation to work.New York Wiley.pp. 157.
J.D. Politis (2001 , (Reiner, & Zhao, 1999).
J.D. Politis (2001) The relationship of various Leadership Styles to Knowledge Management. Leadership and Organization Development Journal, 22(8), p.354-64.
Scandura and Williams, 2004 (Griffin, Patterson and West, 2001).
Spector, P. E. (2000). Industrial & organizational psychology (2nd ed.). New York: John Wiley & Sons.
Yamane (1967:886) framework
Zobal, 1998; Moncarz et al., 2009; Chiu et al., 2002.
☆ Determinants of Employees’ Job Satisfaction; the case of Ambo University
Received 10 January 2023; Accepted 26 February 2023
Available online 1 March 2023